")
Fiscal Analysis of recently formed Union Territory: JAMMU & KASHMIR (J&K)
This article focuses upon Jammu & Kashmir (J&K), now the Union Territory, (earlier state before 2019) whose actual economic status is to this day, shrouded by its complicated political environment. Jammu and Kashmir is the pride of our country in terms of its distinctive visual vistas, its people and its culture.
Despite its unfortunate history since independence, the state has shown tremendous resilience in its economic promises, which although still latent, can yet be fulfilled with proper fiscal management.
The region is by far the largest producer of saffron in India. It is richly adorned with borax and sapphire resources and holds the privilege of being the only reserve for these in the whole country. Besides these, Kashmir also has 36% of India’s graphite, 21% of marble and 14% of gypsum among other resources.
Its weaving, textile handlooms, silk and wool industries carry monumental history in its every fiber, with the carpets and shawls having economic value of special global renown. The name ‘Kashmir Willow’ still strikes a chord amongst cricketing fans worldwide, and Kashmiri Apples account for 78% of India’s total apple exports.
J&K’s Net State Domestic Product (NSDP) increased at a CAGR of 8.61% from 2015-16 to 2020-21 and reached INR 1.49 trillion (US$ 20.49 billion). Total exports from J&K stood at US$ 89.77 million in FY 2022-23 (until August 2022).
Giving due importance to these facts about Kashmir’s economy, this article makes an effort to single out its fiscal administration and analyze it, considering its unique political circumstances.
During this process, it is essential to note two things; first, that being a Union Territory (UT), J&K is administered chiefly by the Lieutenant Governor appointed by the President of India, with all decisions taken after reference from the Central Government and consequently the President. These decisions include ones regarding fiscal management and revenue collection.
Secondly, considering the data attributed to and geographic region officially referred to as ‘Jammu and Kashmir’ differs prior to 2019 and post 2019. The article will only make use of data published post 2019 within the CAG India Audit Reports, the J&K Annual Budget and the Jammu and Kashmir Economic Survey 2022-23.
We will continue our series’ pattern by including the UT’s Debt to GSDP Ratio, Capex and Revenue expenditure. Instead of the Ease of Doing Business Index, we shall make use of the Annual Total Digital Transactions and Investments to get the hold of economic and market activities in the UT.
The intention of this effort will be solely to provide an analysis of the economic and fiscal indicators while keeping in mind J&K’s unique situation.
- Debt to GSDP Ratio
Beginning with our first parameter, reiterating what it indicates, the debt to GSDP ratio is calculated by expressing the ratio of total public liabilities to the total GSDP in percentage terms.
In general it is indicative of the government’s debt situation, where an excessively high ratio can cause severe strain on the state’s fiscal balance leading to inflationary pressures in the economy. Therefore, the Comptroller and Accountant General of India (CAG) have persistently maintained that borrowed funds should be utilized for asset creation and not for the payment of previous debts or for regular operations.
It is for this same reason that the FRBM Act of 2005 has set forth a 25% debt ceiling for all states which has been revised to 20% in 2018.
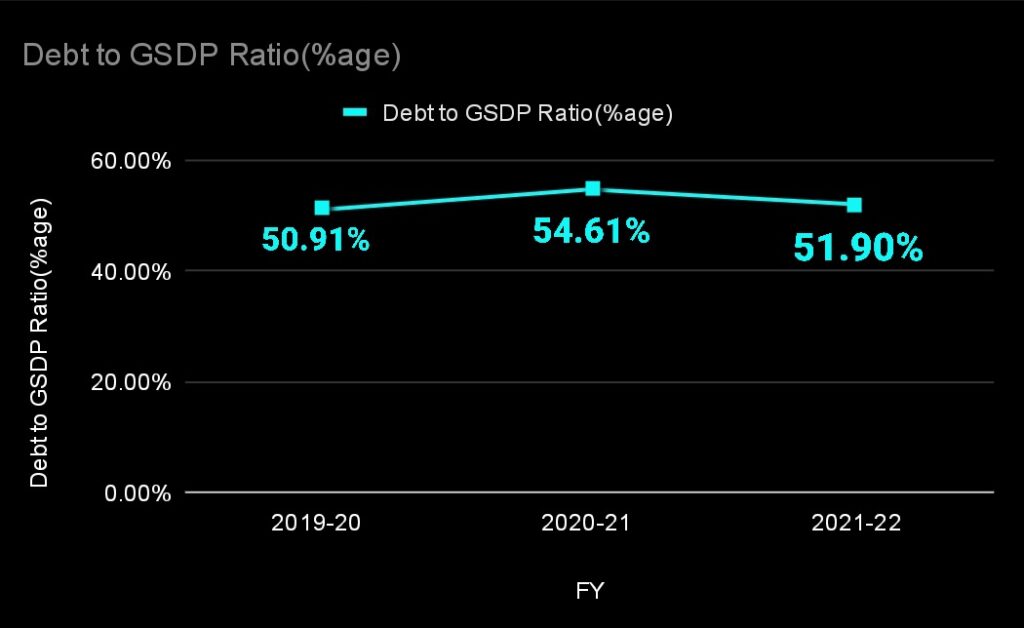
Although at a primary glance the figures seem exceedingly high, it is noteworthy that being a Union Territory in an incessant political storm, these numbers don’t seem too surprising. What might provide a more magnified analysis, is viewing the composition of J&K’s total revenue receipts. The figure below sourced from the J&K Accounts at a Glance 2021-22, points towards this.

When the healthy distribution should be balanced between the three, namely tax revenue, non-tax revenue and Grants in Aid from the Central Government, J&K has a substantially larger component of the latter. This is indicative of poor fiscal management and highlights an urgent need to augment tax collection. It is necessary to point out that according to the J&K Economic Survey 2022-23, the countrywide introduction of the GST taxation system in 2017, placed sizable obstacles in J&K’s revenue generation.
The Economic Survey report mentions that the UT lost INR 1500 crore of annual revenue that it previously generated from Entry Tax, Taxes on Works contracts and VAT on tobacco products.
This brings to light the reasons as to why the debt to GSDP ratio shot back up again above the 50% mark post 2019. Prior to this, the administration had taken several measures to keep it below the 50% mark since the beginning of the last decade. Nevertheless, the CAG has pointed out these warning signs and advised the concerned administration to further increase tax collection.
One positive remark to be made is the exponential increase in GST collection from 2019 to 2022. The below graph illustrates this and is suggestive of the government’s efforts to recoup from the blows done by the loss of the Entry Tax and VAT.

In general, the tax revenue has been consistently rising since the state was reorganized in 2019, which is an optimistic observation.
- Capital Expenditure (Capex)
The capital expenditure or capex of a government refers to the expenditure that directly leads to the creation of assets. The benefits of these are twofold. Primarily they help attract and promote investments within the economy to match up with the business cycles and secondarily, they act as a source of consistent, reliable revenue for the government.
In the case of J&K, this data has been taken from the budget document actuals released by the government and verified from the J&K Accounts at a Glance 2021-22. The Capex figures seem to be rising which is a largely positive sign.

The advisable way of looking at this is to achieve the right balance between the Capex and Revenue expenditure (Revex). This is the expenditure by the government for its day to day operations including the payment of salaries of its employees across various departments. Too high a Revex leaves little room for growth as it stunts the potential for asset creation that injects long term productivity in the economy.
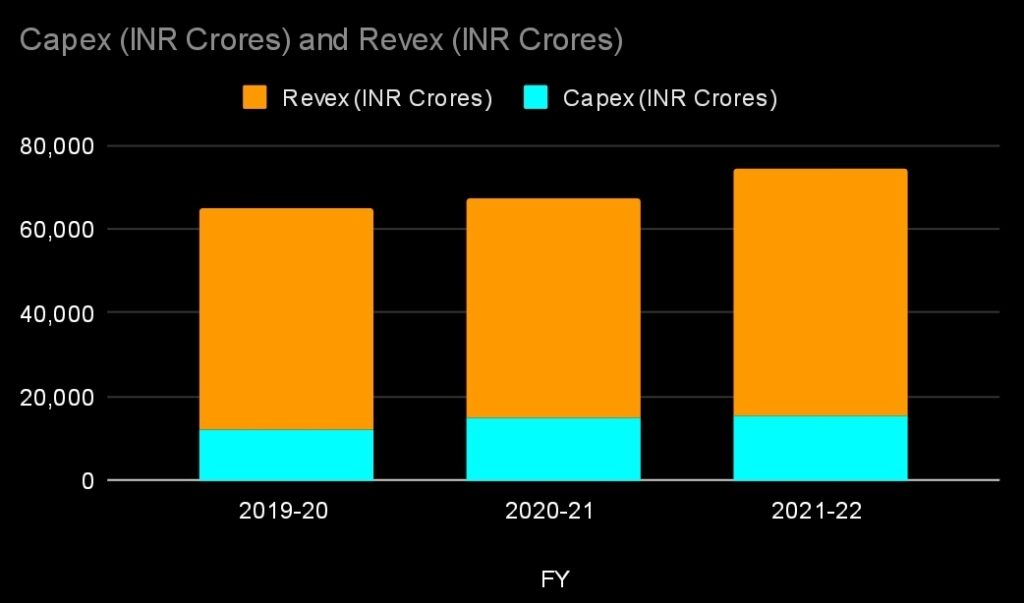
The recorded Revex for FY 2019-20 was INR 52,964 crore, which increased to INR 59,269in FY 2021-22, while the capex also increased during this period, the gap between the two widened by INR 4000 crore. Although not a severe signal, this does warrant the government to be cautious in its allocation, the widening of this might choke long term growth in the future.
Coming to the parameters on education and health, the UT has done surprisingly and overwhelmingly well. Education and health and welfare are its top priorities in budget allocation. The Gross Enrollment Ratio (percentage of the number of students enrolled in educational institutions divided by the total number of students in the eligible age for that institution), for higher educational institutions is 31.2% as recorded in 2021.
This is even higher than states like Jharkhand which we reviewed in our previous article. Although the National Education Policy (NEP) 2020 target is 50% for all states and UTs and much work remains to be done on this front, considering the political challenges in the state, this score is commendable and evidently higher than most other Indian states. J&K even scored higher than Arunachal Pradesh, Meghalaya and Uttar Pradesh in a 2021 report by NITI Aayog in its School Educational Quality Index.
In terms of health, the region is yet to take longer strides as the RBI Handbook of State Statistics records only 1275 government hospitals amounting to 4418 beds. Despite this, the infant mortality ratio stood at a respectable 17 per thousand births in 2020 which is even lower than Karnataka, a far more developed state.
- Digital Transactions and Infrastructure
The intention behind including this section was to understand the UT’s adaptability to changing technology and incorporating modern methods in its public policy and governance. The underlying assumption is that an increase in transactions is indicative of not just the people’s progress but the government’s progress as well.
The data for this section is sourced from the National Payments Corporation of India, in regards to the monthly NFS payments made across all districts in the UT. According to the aforementioned source, in 2021 the UT recorded 34.91 Million payments; in 2022 it had 36.42 million payments; and, till April 2023, it has recorded 11.55 million payments.
- Investments
Speaking on the J&K Budget 2023-24, L-G Sinha said that the highest ever investment of ₹1,547.87 crore received during the last 10 months of this year and Five hundred start-ups have come up during the last three years.
Recently, the UT even saw its very first FDI project post the abrogation of article 370. A shopping mall and multipurpose tower marked the INR 500 Crore investment on the outskirts of Srinagar, made by the very makers of the Burj Khalifa, the Emaar Group.
According to the Department for Promotion of Industry and Internal Trade (DPIIT), cumulative FDI inflow in J&K was valued at US$ 0.7763 million from October 2019 to June 2022.
Investments
Concluding Remarks
J&K has so far been the most difficult analysis of this series. The reasons behind this are many, from obtaining reliable data sources to finding the appropriate metrics to gauge the performance of this region. Yet, the efforts of putting this article together have been rewarding and are undertaken with the unmoving intent of providing an unbiased, strictly economic examination.
The discrepancies between Budgeted Estimates and Actuals of the annual capex are extraordinarily high. The administration has annually planned for a higher capex which its revenue receipts have not been able to avail and have necessitated the undertaking of further loans. Therefore, improving upon the tax revenue would lead to proper fiscal management along with controlled debt and allow an inclination towards increasing the capex for the better.
It is undeniable that J&K has had a complicated past and its way towards becoming a normal functioning economy is riddled with obstacles ahead. However with each passing decade it has shown inspiring resilience and responded positively to policy changes.
The way ahead seems positively lit, with promising steps taken by the government in increasing capex towards tourism, its indigenous cottage industries and education.
Aarya Gandre
Aarya Gandre is a Research Intern at Tatvita Analysts. He is pursuing his Bachelors in Economics.
