
Zonal Comparison of Aspirational Districts in India
In this analytics, the objective is to understand the level of growth and development of the aspirational districts. To analyze the regional balance or imbalance, a comparative analysis based on the zonal councils or zones has been undertaken.
Geographical area-wise, India is the 7th largest country in the world with an area of 32,87,263 sq. km (1,269,346 sq mi). For administration, facilitation, and instilling cooperative nature amongst the states, five main zonal councils were created. Presently, there are a total of six, including the North-Eastern Council. The five zonal councils are Northern; Central; Eastern; Western; and Southern. The States in India as per their location falls into the zonal councils.
‘Aspirational Districts’ programme was launched in the year 2018 to transform 112 most under-developed districts across the country. To understand if the facilities, perks, and schemes have trickled down from India-level to Gram Panchayat-level, the data from Mission Antodaya 2020 has been used here.

The Northern Zonal Council, comprises the States of Haryana, Himachal Pradesh, Jammu & Kashmir, Punjab, Rajasthan, National Capital Territory of Delhi, and Union Territory of Chandigarh. The Central Zonal Council, comprises the States of Chhattisgarh, Uttarakhand, Uttar Pradesh, and Madhya Pradesh. The Eastern Zonal Council, comprises the States of Bihar, Jharkhand, Orissa, Sikkim, and West Bengal. The Western Zonal Council, comprising the States of Goa, Gujarat, Maharashtra, and the Union Territories of Daman & Diu and Dadra & Nagar Haveli. The Southern Zonal Council, comprises the States of Andhra Pradesh, Karnataka, Kerala, Tamil Nadu, and the Union Territory of Puducherry. Lastly, the North-Eastern Council includes the following states Assam, Arunachal Pradesh, Manipur, Tripura, Mizoram, Meghalaya, Nagaland, and Sikkim.
Figure 1 above shows the zonal councils, states in those zones, and aspirational districts in each of the states of India. These details have formed the basis of the comparative analysis.
Moving ahead, the data available on the portal contains 30 categories and out of them, 10 categories have been selected based on considered necessities for rural development. The respective villages in aspirational districts to be a part of this study are subject to the availability of the data for selected categories and their variables.
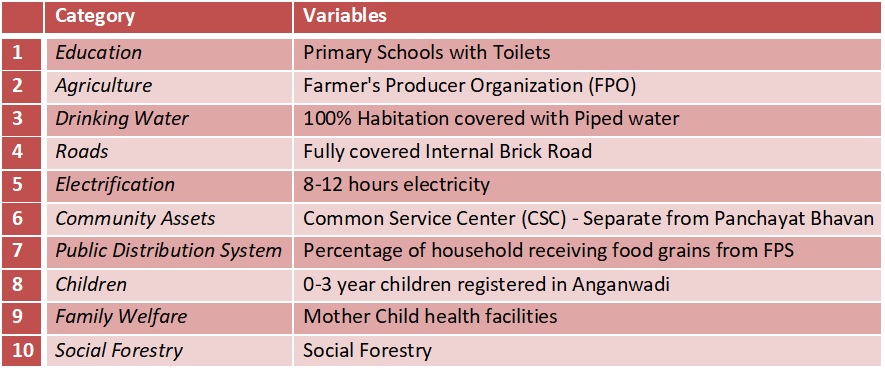
The categories above include socio-economic and policy indicators. Data for each category and variable was taken into consideration for zonal comparison of the aspirational districts.
A statistical tool called, ‘Gini Coefficient’ has been used to study the growth, and inequality in zones. The Gini index, or Gini coefficient, is a statistical measure of economic inequality in a population. It was developed by the Italian statistician Corrado Gini in 1912. The coefficient ranges from 0 (or 0%) to 1 (or 100%), with 0 representing perfect equality and 1 representing perfect inequality.
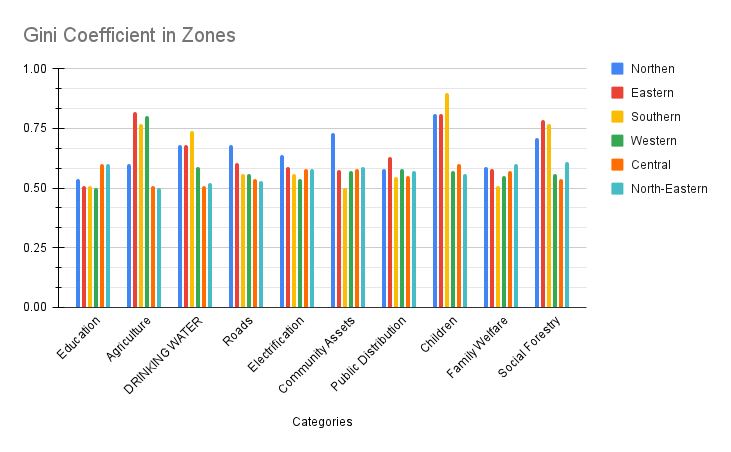
As per the Gini Coefficients a higher amount of inequality across zones can be seen in agriculture, children registrations in Anganwadi, social forestry, and community assets. It is followed by variations in roads, drinking water, electrification, and education. Overall, the public distribution system and family welfare schemes and their reach to the beneficiaries are similar in all the zones.
There are two possibilities to be noticed. The first is that in a zone or a state, there is a possibility of one region is developed and the other is lagging behind hence the prevalence of inequality is more. The second possibility is that the population, area, or size, of the zone or state, is small and reporting of facilities is low or vice versa, therefore, the inequality has not been noticed. Hence definite inferences cannot be drawn without a detailed study of each zone, state, or aspirational district and village.
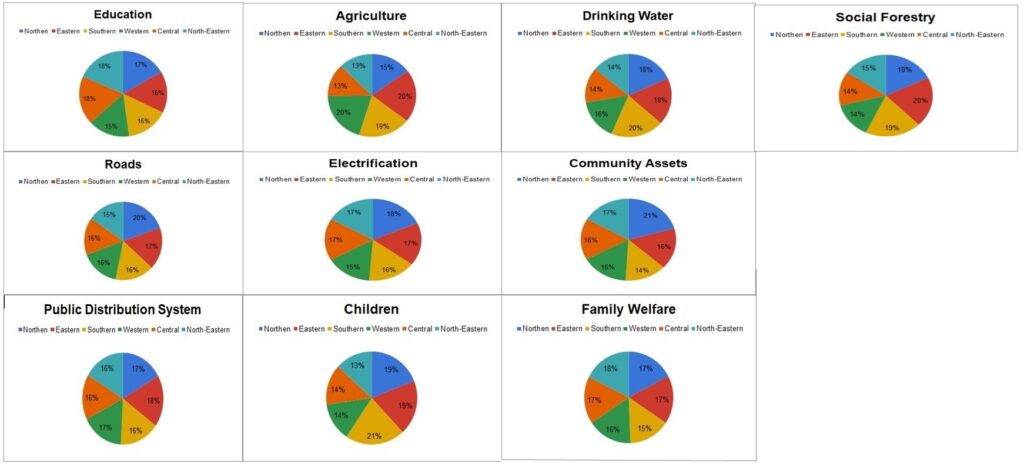
From the percentages in figure 3 above, it can be observed that in the category of Education inequality prevails in the North-Eastern and Central zones. In agriculture, it is found in the Western zone. Eastern and Northern zones witness a lack of availability of drinking water. The Northern zone has the highest inequality in terms of roads, electrification, and community assets respectively. The Eastern zone lags in the public distribution system. With regards to children of 0-3 years admitted in Anganwadi Southern states differ in the levels of registrations. In maternal healthcare which is a part of the family welfare category, North-Eastern states are yet to reach their potential. Social Forestry is a source of income for many tribes Eastern regions are found with the highest inequality.
Understanding the prevalence of inequality with the help of zonal comparison would help in tackling the developmental challenges in a better way. It would guide the areas, zones, states, and villages to be stressed upon.

Knowledge-sharing platform is aimed at providing analytical insights into Economy, Public Policy and Foreign Policy.
