
Tariffs on Indian Exports
Tariffs on imports constitute an important part of any trade agreement. Tariffs are, simply put, taxes on trade of commodities. They are used to restrict imports to ensure that domestic producers have an equal chance of competing with foreign producers. They increase the prices of goods and services purchased from foreign countries, thereby making them less attractive in the domestic economy.
In this article, we analyse the tariffs imposed on imported goods in India and the tariffs that Indian exports face in foreign countries. For the purpose of analysis, we make reference to annual reports of ‘World Tariff Profiles’ for the years 2017 and 2022. The report is a joint publication by the World Trade Organisation (WTO), the International Trade Centre (ITC) and the United Nations Conference on Trade and Development (UNCTAD). It is devoted to market access for goods. The report highlights an individual tariff profile for all WTO members and other countries. Each profile is divided into two parts: Part A presents information on tariffs imposed by each economy on its imports, while Part B is an analysis of market access conditions it faces in its major export markets. Our analysis focuses on these two parts of India’s tariff profile.
Part A
This is divided into two parts. Part A.1 and Part A.2. The first part A.1 gives information on agricultural and non-agricultural duties, while second part A.2 deals with tariffs by product groups.
Part A.1: Agricultural and Non-agricultural duties
In this section, we analyse the changes in tariff lines and import values for agricultural and non-agricultural products from 2017 to 2022. The following table shows the percentage change in tariff lines and import values. This table indicates a range of tariffs India imposed on imports from foreign countries.

The above table highlights the percentage of final bound tariffs, MFN applied tariffs and import values that fall under a particular tariff range.
Final bound tariff rates refer to a ceiling of tariffs for a commodity or product category. Members have the flexibility to increase or decrease their tariffs (on a non-discriminatory basis) so long as they do not raise them above their bound levels. The applied tariff is less than or equal to the bound tariff in practice for any particular product. When countries join the WTO or when WTO members negotiate tariff levels with each other during trade rounds, they make agreements about bound tariff rates, rather than actually applied rates.
MFN stands for Most Favoured Nation which is an essential principle in WTO for multilateral trade. It ensures non-discrimination between trading partners. If a WTO member grants an advantage to a country, it must give the same advantage to all WTO members. It ensures that every time a WTO member lowers a trade barrier or opens a market, it must do so for similar goods & services from all WTO members, without any regard to the members’ economic size or level of development. The opposite is, however, not an obligation. Preferential trade agreements or free trade agreements are exceptions to MFN. The principle is applicable to trade-in-goods, services, and intellectual property. Thus, MFN applied tariffs are the actual tariff rates for a commodity.
In the table above, it is seen that in a span of five years under many tariff ranges, India has lowered its Final Bound rates and MFN applied tariff rates for the two product categories. For Final Bound duties under agricultural products, the largest decline is 13.64%, under the range ‘15<=25’ from 2.2% in 2016 to 1.9% in 2021. The largest increase was 100% under the range ‘10<=15’, from 0.2% in 2016 to 0.4% in 2021. For MFN Duties under agricultural products, the largest decline is 100% under the range ‘0<=5’, from 3.6% in 2016 to 0% in 2021. The largest increase is 45.78% under the range ‘50<=100’, from 8.3% in 2016 to 21.1% in 2021. For imports under agricultural products, the largest decline in the tariff lines is 100% under the range ‘0<=5’, from 2.5% in 2015 to 0% in 2020.
Under non-agricultural products, for Final Bound duties, the largest decline is 2.15% under the range ‘25<=50’, from 51.2% in 2016 to 50.1% in 2021. However, the largest increase is 400% under the range ‘>100’, from 0.2% in 2016 to 1% in 2021. For MFN applied tariff rates, the largest decline of 49.47% was registered under the range ‘0<=5’, from 9.5% in 2016 to 4. % in 2021. The largest increase was 525% under the range ‘10<=15’, from 1.6% in 2016 to 10 % in 2021. The percentage change under the range ‘>100’ is undefined since the values changed from 0% in 2016 to 0.5% in 2021. For imports, the largest decline was 77.94% under the range of ‘Duty-free tariffs’, from 28.1% in 2015 to 6.2% in 2020. However, the largest increase was 7100% registered under the range ‘15<=25’, from 0.1 % in 2015 to 7.2 % in 2020.
NAV stands for non-ad valorem. Ad valorem is a latin term for “according to the value”. It is a tax that is proportional to the value of the imports. In the above table, NAV represents the tariffs that are not proportional to the value of imports. There has been no change in NAV, under Agricultural Products, for Final Bound duties and MFN Applied Tariffs. The values for both in 2016 and 2021 is 0.3 % each. Imports under NAV have increased from 3.4% in 2015 to 4.1% in 2020. However, under non-agricultural products, Final Bound duties have decreased by 3.39%, from 5.9% in 2016 to 5.7% in 2021. Similarly, MFN applied duties have decreased by 3.51% from 5.7% in 2016 to 5.5% in 2021. Imports under NAV also registered a decline of 50% from 0.8% in 2015 to 0.4% in 2020.
Part A.2: Tariffs by product groups
In this section, we analyse the changes in MFN applied duties from 2017 to 2022 for different commodities in the product groups. The commodities included in these product groups are basically classified into agricultural products and non-agricultural products.
The category of agricultural products include animal products, dairy products, fruits, vegetables, plants, coffee, tea, cereals & preparations, oilseeds, fats and oils, sugars and confectionery, beverages and tobacco, cotton, and other agricultural products.
Fish and fish products, minerals and metals, petroleum, chemicals, wood, paper, etc., textiles, clothing, leather, footwear, etc., non-electrical machinery, electrical equipment, transport equipment, and manufactures not elsewhere specified constitute non-agricultural products.
Tariffs by product groups in 2017 & 2022:
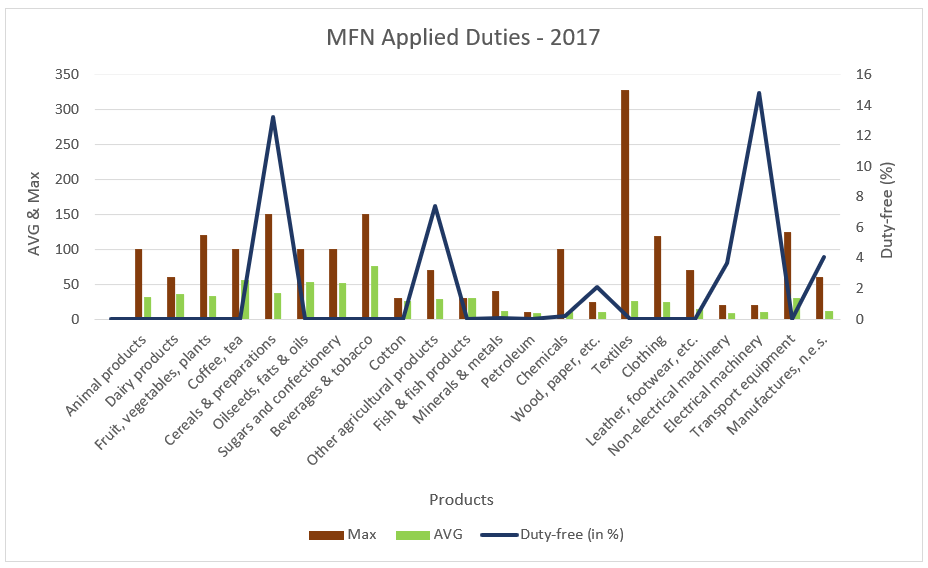

When compared the MFN Max i.e, the highest ad valorem duty or calculated ad-valorem equivalent (AVE) within the product group of 2022 with that of 2017, it is observed that in 2017, the highest MFN Max was applied to textiles (328%), followed by cereals & preparations and beverages & tobacco (150% each). In 2022, the highest MFN max was applied to cereals & preparations and beverages & tobacco (150% each), followed by animal products, fruits, vegetables & plants, coffee & tea, oilseeds, fats & oils, and transport equipment (100% each). The MFN Max for textiles in 2022 was 90%, a decline of 264%.
Similarly, when comparing MFN AVG, that is, a simple average of MFN Applied duties, in 2017, the highest MFN AVG was 76.3% for beverages & tobacco. This is followed by coffee, tea and oilseeds, fats & oils, 56.3% and 53.4% respectively. In 2022, the highest MFN AVG was 68.6% for beverages & tobacco, a decline of 11.22%. This was followed by coffee & tea and sugars & confectionery, 56.3% and 35.9% respectively.
Lastly, when comparing MFN Duty-free i.e. the share of duty-free HS six-digit subheadings in the total number of subheadings in the product group for these two years, it is noted that in 2017 the commodity with the highest duty-free percentage was electrical machinery (14.8%), followed by cereals & preparations (13.2%) and other agricultural products (7.4%). In 2022, the commodity with the highest duty-free % was cotton (80%), followed by petroleum (16.7%) and electrical machinery (16.2%). The MFN Duty-free for electrical machinery registered a growth of 9.45%, while the MFN duty-free for cereals & preparation and other agricultural products increased to 15.4% and 13.6% respectively.
Moving ahead from the analysis of export tariffs across products from India, the next section deals with tariffs levied on India’s exports by its top trading partners. It includes information related to tariffs on agricultural and non-agricultural products in the years 2017 and 2022.
Part B: Exports to India’s major trading partners and duties faced

The figure 4 above shows India’s top trading partners for 2017 and 2022. In 2017, the European Union (EU), USA, Saudi Arabia, UAE, and Bangladesh were top 5 trading partners in agriculture. However, the scenario was shuffled in 2022 as the USA became the top trading partner before the EU, followed by the UAE, and lastly, China.
In general, as can be seen, tariffs over non-agricultural products are less than agricultural products. These tariffs are simple averages of MFN traded tariff line in percentages. Except Saudi Arabia, who has reduced tariffs on agricultural products from 13.9% to 8.1%, all other top trading partners of India have increased the tariffs from 2017 to 2022.
In 2022, among top 5 trading partners China imposes the highest tariffs over agricultural products from India at the rate of 13.8%, followed by the EU with 13%.
In terms of non-agricultural products, the USA and the EU held top two positions for both years. China came on to third position in 2022 from fifth in 2017. The UAE and Hong Kong were dropped by one-one rank each in 2022 from third and fourth to fourth and fifth respectively.
Further, one does not see changes in most of India’s trading partners with respect to tariffs on non-agricultural products. From 2017 to 2022, they have been constant for the USA (4.3%), the EU (4.5%), UAE (4.6%), Hong Kong (0%). However, China has reduced the tariff charges from 9.5% in 2017 to 6.1%.
Understanding tariff rates shows India’s export basket is tilted towards agricultural products that have to be diversified. Also, from looking at India’s top 5 trading partners and if India holds the same position in those respective countries’ trade partners list (for 2022), it was found that the case is not the same. India is one of the top five trading partners of non-agricultural products for Hong Kong, Saudi Arabia, and for UAE both agricultural and non-agricultural products. India is not among the top five trading partners for the USA, EU, and China neither for agricultural products nor for non-agricultural products.
This is a clear indication for India to expand its partnerships. As India’s trade potential lies in exploring the geo-economics dimension not just across nations but also across products.

Knowledge-sharing platform is aimed at providing analytical insights into Economy, Public Policy and Foreign Policy.

Do you mind if I quote a few of your articles as long as I provide credit and sources back to your weblog? My blog is in the exact same area of interest as yours and my visitors would definitely benefit from a lot of the information you present here. Please let me know if this alright with you. Thanks!
I really appreciate the kind of topics post here. Thanks for sharing us a great information that is actually helpful. Good day! 123Movies
I love visiting sites in my free time. I have visited many sites but did not find any site more efficient than yours. Thanks for the nudge! Putlocker