
District wise Analysis of Maharashtra’s Economy
Maharashtra is one of India’s largest and wealthiest states, with a robust economy that ranks among the country’s most significant. The economy of the state is diverse, having a major presence in the manufacturing, services, and agriculture sector. Maharashtra has a strong history of industrialization that predates independence. Maharashtra is India’s economic powerhouse, in 2021-22AE, Maharashtra’s gross state domestic product was predicted to be Rs. 31.98 trillion (US$ 430.62 billion) at current prices, accounting for an estimated 14% of the country’s aggregate.
The state’s social, physical, and industrial infrastructures are all well-developed. Throughout the last decade, Maharashtra’s infrastructure sector has risen dramatically, with a major increase in the number of industrial clusters and public-private partnership (PPP) projects. Several major and minor companies are located in the state’s industrial clusters, which include Mumbai-Pune, Nashik, Aurangabad, Nagpur, and Kolhapur. Among other things, the state is a key manufacturer of textiles, vehicles, chemicals, and engineering items.
As reported by the Directorate for Promotion of Industry and Internal Trade (DPIIT), FDI inflows in Maharashtra totalled US$ 44,405.66 million between October 2019 and June 2022, accounting for 27.94% of total FDI inflows in India. At Magnetic Maharashtra 2.0 in June 2020, the state received investment offers worth Rs. 1.13 lakh crore (US$ 15.23 billion), with projected employment of over 2.50 lakh. In FY23, the state’s total exports were US$ 31.65 billion (until August 2022). Maharashtra exported key commodities such as pearls, precious and semi-precious stones, gold and other precious metal jewellery, iron and steel, and drug formulation.
The service sector is the state’s major contributor, generating over fifty per cent of the state’s GDP. Mumbai, the state capital of Maharashtra, is India’s financial and commercial capital and home to the country’s largest stock market. The state is also a technological hotspot, with various software parks and IT enterprises based within. Although being a largely urbanised state, agriculture is still an important economic sector in Maharashtra, contributing considerably to the state’s economy. Among other products, the state is a notable producer of sugarcane, grapes, oranges, pomegranates, and onions. Maharashtra also has a significant dairy industry, ranking seventh in India in terms of milk production.
Measuring the District’s Income
Gross State Domestic Product (GSDP) is a key economic statistic that depicts economic development and structural changes.
Gross District Domestic Product (GDDP) is an essential indication of the District’s economic progress. GDDP is the total value of all products and services produced within a district’s geographical borders over a certain time period, generally a year. It is computed by aggregating the value of all goods and services generated in the district, which includes agriculture, manufacturing, construction, and services.
GDDP is a critical instrument for policymakers because it gives a more localised view of economic growth than standard indicators like Gross Domestic Product (GDP). GDDP may assist identify areas of strength and weakness and advise policymakers in their attempts to promote economic development by evaluating economic activity within a certain district.
In this article, we try to analyse the change in the CAGR of districts in three sectors namely, Primary, Secondary and Tertiary.
Primary Sector
This sector covers of production of Crops; Livestock; Forestry and Logging; Fishing and aquaculture; Agriculture & Allied Activities; and, Mining & Quarrying.
Secondary Sector
Manufacturing; Water Supply & electricity; and, construction comprise of the secondary sector. The estimates of GSDP from this sector are prepared using the production approach. For the manufacturing, electricity, gas, water supply, and other utility services, as well as the construction sector, the state-level value added is allocated among districts in proportion to the district-wise labour input based on the Population Census 2011 (Main and Marginal workers, excluding cultivators and agricultural labourers). The proportion of Gross State Value-Added (GSVA) of the given sector and Goss District Value-Added (GDVA) of industry and services of the particular district is used to obtain sector-wise value added.
Tertiary/Services Sector
This sector includes Industry; Trade, Repair, Hotels & Restaurants; Railways Transport (by means other than Railways); Storage; Commercial and services related to Broad Financial Services; Real Estate; Dwellings; and Professional Services, Public Administration and, Defence; and, Other Services. The services sector encompasses activities in which people offer their expertise and time to produce services. It includes various sub-sectors such as railways, transport, storage, trade, repair, hotels and restaurants, communication, financial services, real estate, ownership of dwelling, professional services, public administration, defence, and other services.
District Level composition of Sectors
The State has 36 districts which are divided into six revenue divisions viz. Konkan, Pune, Nashik, Aurangabad, Amravati and Nagpur for administrative purposes. The State has a long tradition of having statutory bodies for planning at the district level. The article presents the DDP for 36 districts of Maharashtra. Due to the non-availability of separate data for Mumbai city & Mumbai suburban and Thane & Palghar districts combined DDP for Mumbai and Thane district is prepared.
In the state’s GSVA, the average proportion of the Primary Sector was around 11.9%. The districts of Pune in the Pune region and Nashik and Ahmednagar in the Nashik region contribute the most to the GSVA of this sector.
The Secondary Sector accounts for around 32% of the State’s GSVA, with the Konkan and Pune divisions accounting for the most. The Konkan region’s Mumbai and Thane districts, as well as the Pune region’s Pune district, have the highest proportion of this sector’s GSVA. Manufacturing is a significant sector, accounting for around 20% of the state’s GSVA. The districts of Mumbai and Thane have the highest GSVA proportion in the manufacturing sector in the state.
In 2020-21, the Tertiary Sector contributed a staggering 56.1% of the state’s GSVA and continues to be a key contributor to the state’s economy. This sector is primarily concentrated in the Konkan and Pune areas. The Konkan region’s Mumbai and Thane districts, as well as the Pune region’s Pune district, have the highest proportion of this sector’s GSVA. ‘Real estate and OD & Professional Services’ and ‘Finance services’ are key contributors to GSVA of the services industry.
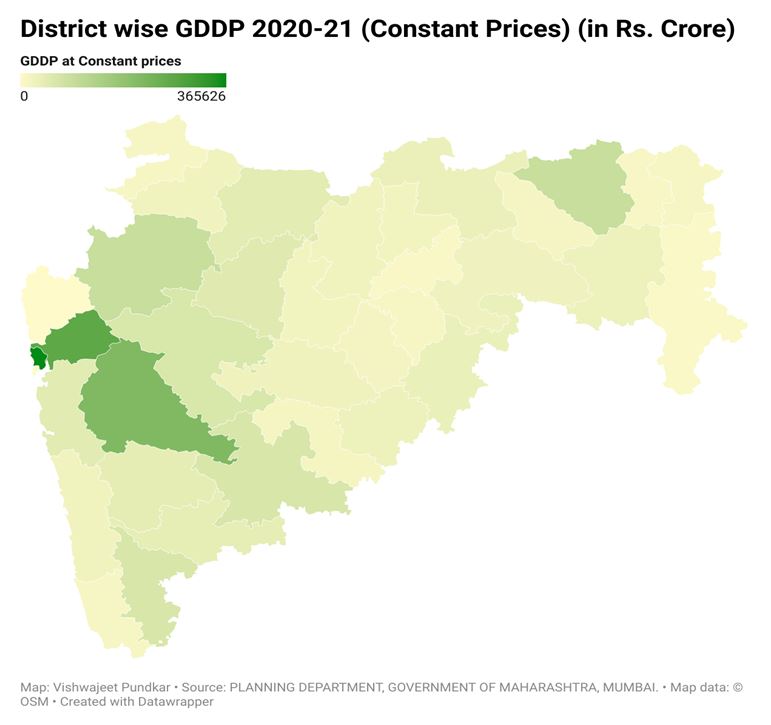
As evident from the illustration, the districts of Mumbai (Mumbai City and Mumbai Suburban), Thane (Thane and Palghar), Nashik and Nagpur are the top five most contributing districts to the state’s GSDP. The top three districts account for a whopping 45% of the state’s GDP while the top five districts have a lion’s share of more than half (approx. 54%) in the state’s GDP. This highlights the disparity in the concentration of industrial activities as the distribution of industries and economic activity within Maharashtra is highly concentrated in certain regions and sectors, leading to uneven development across districts. For example, Mumbai and Pune are major centres for the automobile and information technology industries, respectively, and these industries have driven economic growth in these districts.
On the other hand, the districts of Gadchiroli, Washim, Bhandara, and Hingoli are at the bottom of the list due to their low GDDP. The majority of districts from the Marathwada and Vidarbha regions continue to be at the lower side of the GDDP. This marks the urban-rural divide in Maharashtra, with urban areas generally being more developed and prosperous than rural areas. This divide is particularly stark in districts like Nandurbar and Gadchiroli, which have a predominantly rural population and limited access to economic opportunities.
District Income Insights
The map of Maharashtra below shows the Compound Annual Growth Rate of Gross District Domestic Product, i.e. income growth of each district from 2011-12 to 2020-21.

Majority of the districts have Maharashtra have had a CAGR of around 4.12% to 5.24%; some of them had 5.24% to 6.37%. Hingoli district is an exception as it has grown for more than 7.49% from 2011-12 to 2020-21 at constant prices which means taking into account the inflation so at real growth rate.
Moreover, to real growth rate, in order to understand the changes in standard of living of people in different districts, we analyzed the Per Capita GDDP.
Range Plot of Per Capita GDDP

Though starting point of each district as in the Per Capita Income in 2011-12 was different but for all districts range plot moves from left to right showing positive growth rate or increase in the income levels. Almost all districts has increased by approximately 3% to 5%, only exception is Hingoli whose Per Capita GDDP has increased by 7.78% from 2011-12 to 2020-21.
Sectoral Analysis
To understand the stage of progress happened in each sector in each district of Maharashtra, we have resorted to calculate change in sectoral contribution to state’s total production in that sector from 2011-12 to 2020-21.

The red coloured cells in the above graph show that there is an extreme negative growth meaning sector’s contribution from a particular district to state’s total sectoral production has reduced from 2011-12 to 2020-21. Further, orange coloured cells demonstrate a medium level growth rate; and green coloured cells mean that there is a positive growth rate in that particular sector in that district over a period of time.
As can be seen, variations from negative growth to positive growth have occurred in the primary sector. For example, Thane witness positive growth rate and Hingoli witness negative growth rate. Secondary and Tertiary sectors are majorly orange coloured cells saying that the change in the sectoral contribution to state’s total contribution has changed by mild units.
Compound Annual Growth Rate from 2011-12 to 2020-21
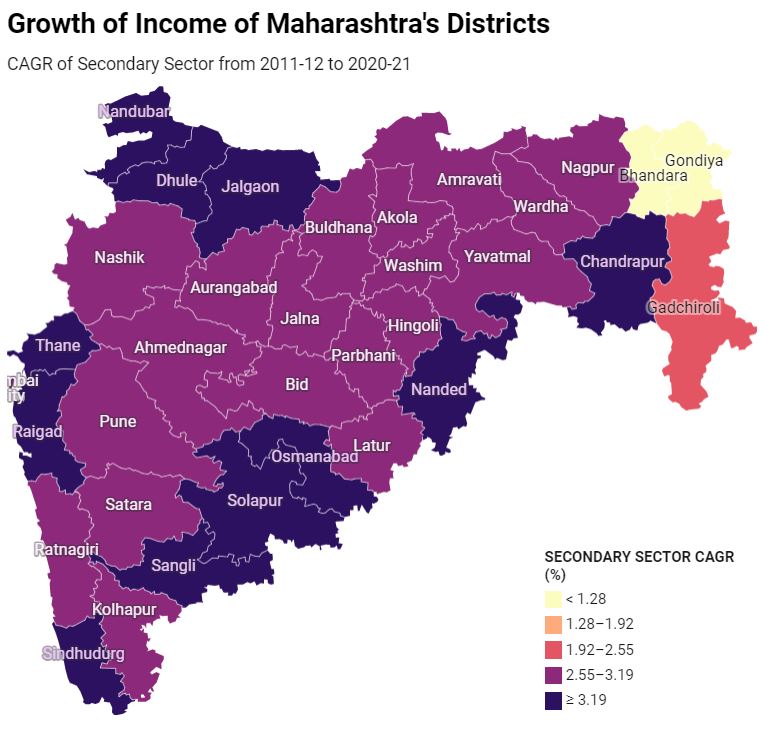
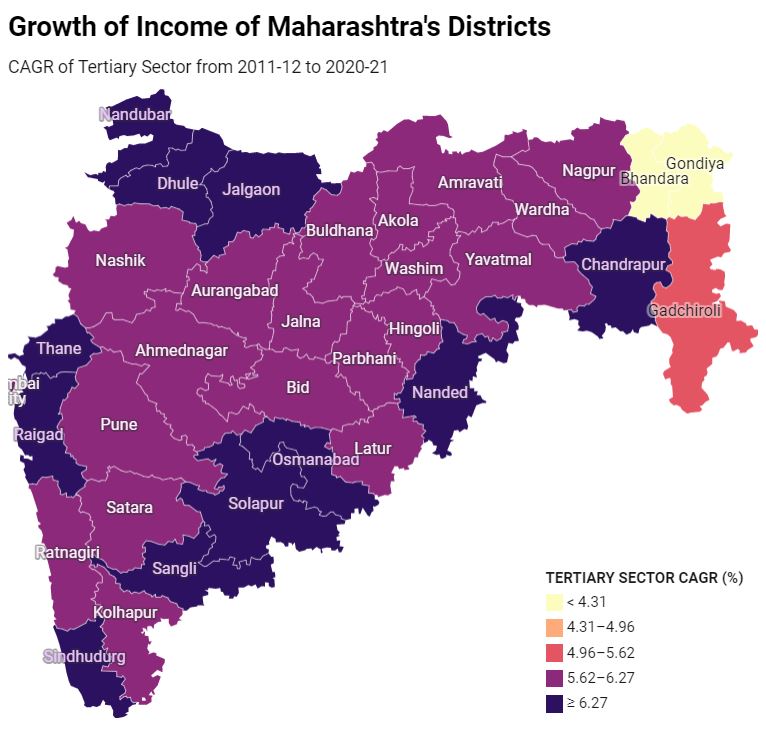
Additionally, to dive deep into the details, we calculated Compound Annual Growth Rate (CAGR) of each sector from 2011-12 to 2020-21 portrayed in the Maharashtra’s map below.

This particular map of Maharashtra shows us that how income from primary sector has increased for each district from 2011-12 to 2020-21. Only for Hingoli district the CAGR is more than 11.16%.
For Bhandara and Gondiya the range of growth is lies between 8% to 11.16%. On the contrary for same districts along with Gadchiroli, in the Secondary Sector, the growth rate has been the lowest compared to other districts of Maharashtra.
Lastly, in the service sector’s CAGR it is found that the minimum value of range start with 4.31% goes till 6.27%. This supports the fact that contribution of service sector in any state or Indian economy is massive, followed by the primary sector.
Overall, the district wise analysis shows the variation in economic activities across the state of Maharashtra. For example, the district of Hingoli has found to have different rates of real growth. The investigation of this sort should be undertaken extensively on the basis of data collected from the ground-level to get a clearer picture.
The analysis of individual and unique data points will help in setting up and improving evidence-based policymaking to ensure efficiency and inclusivity across the state.
Hence each of them should be developed on the basis of their strengths and certainly not under one policy as one size would not fit all.

Vaibhavi Pingale
Ms. Vaibhavi Pingale is a Visiting Faculty of Economics at Gokhale Institute of Politics and Economics, Pune & at Savitribai Phule Pune University. She is pursuing her PhD. She has been actively writing media articles other than academic research.

Vishwajeet Pundkar
Mr. Vishwajeet Pundkar is pursuing his Graduation in Economics from MITWPU. Presently, works as a research intern at Tatvita Analyst.

Santoshi Rajguru
Santoshi Rajguru is a Data Scientist at Tatvita Analysts. She has pursued Masters in Statistics and works on various projects as researcher and data analyst.

Informative article…Great Insights….Kudos to the team!!!
May I know the reference/source for the dataset regarding the Economic activity? Asking this, as I would like to refer to the same for my knowlege.