
Bhutan’s Energy Security
The Kingdom of Bhutan is the world’s first and only carbon negative country. Forests cover 70% of its land which sequesters more carbon than the entire nation emits. It is a constitutional obligation to maintain at least 60% forest cover in the country. The country is well known for its growth and development measuring initiative called the Gross National Happiness (GNH) as being more important than Gross National Income (GNI).
Bhutan is in many ways among the most environmentally evolved nations on earth. It is an environmentally conscious country which produces renewable electricity from their fast flowing rivers. The identified sources of energy include coal, gas, hydropower, solar, wind, oil, nuclear, bioenergy, and other renewable energy sources.
By exporting their renewable energy, Bhutan offsets about six million tons of carbon dioxide within their surrounding countries. Out of all the above-mentioned sources of electricity generation, the prominent source has been hydropower in Bhutan. The sale of hydropower accounted for the largest share of the country’s GDP. It is also the most important export item contributing about 63% percent of Bhutan’s total exports.
Clean Energy Production through Hydropower as the Source
Indo-Bhutan hydropower cooperation began in 1961 with the signing of the Jaldhaka agreement. The Jaldhaka project is situated on the Indian side of Indo-Bhutan border in West Bengal. The major part of power produced at Jaldhaka hydropower plant was exported to southern Bhutan.
A landmark development in the history of Indo-Bhutan hydro-relations took place in 1987 with the commissioning of the 336 MW Chukha Hydropower Project (CHP). Bhutan’s first mega power project, CHP was fully funded by the Government of India with 60% grant and 40% loan at the interest rate of 5% payable over a period of 15 years after commissioning. The then Indian President R.Venketaraman inaugurated the project. The resounding success and economic viability and benefits brought by CHP made way for other projects. The 1,020 MW Tala Hydroelectric Project, one of the biggest joint projects between India and Bhutan, was also financed by the Government of India, with 60% grant and 40% loan.
The two countries have signed the Agreement on Cooperation in the Field of Hydroelectric Power (HEP) in July 2006, which outlines the framework for cooperation in the field of hydropower. Under the May 2008 Protocol, the two governments also established the Empowered Joint Group to expedite the development of hydropower projects in Bhutan.
In this article, we explore the situation of electricity produced or generated along with energy consumed from access to demand, over the years and present-day challenges with a way forward for Bhutan.
Electricity Production/ Generation in Bhutan
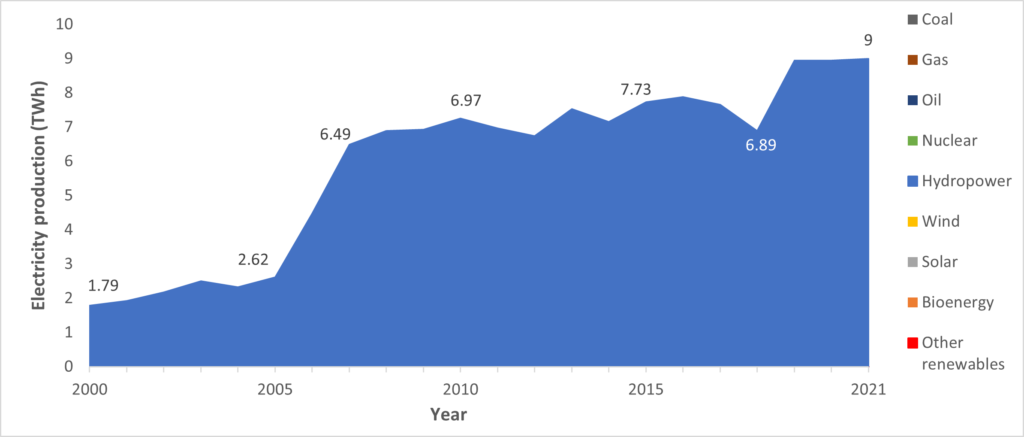
The following figure shows the electricity generated in Bhutan since the year 2000.

The electricity generated in 2000 was 1.79 Terawatt-hour (TWh), and reached 9 TWh by 2021, resulting in a 403% increase. It can be seen that electricity generated sharply rose in 2007 to 6.49 TWh and has been consistently growing since then.
With respect to per capita electricity generation, an average of 8,256.71 kWh has been generated per capita between 2000 and 2021. The per capita electricity generated in 2000 was 3048.31 kWh, which increased by 280 per cent to 11,575.56 kWh in 2021. The trends in per capita electricity generation have been captured in the graph below.
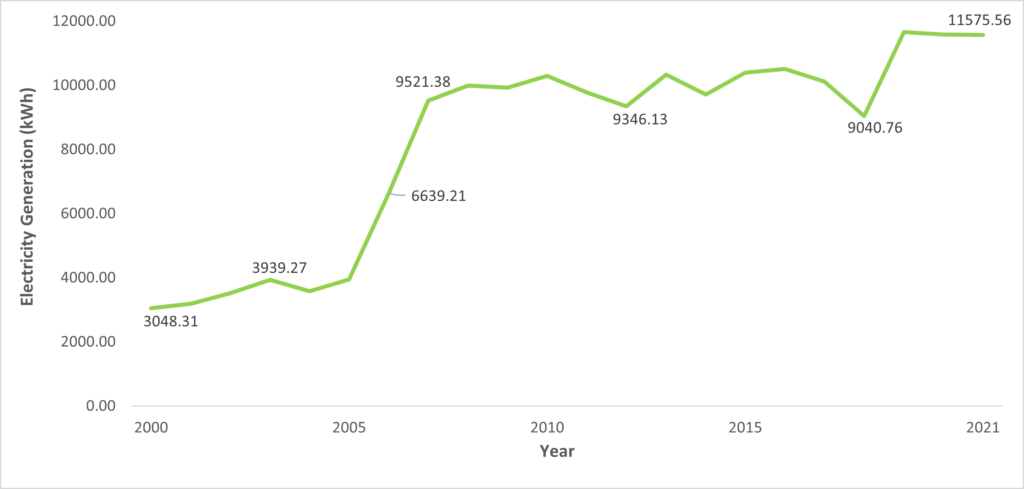
Source: Our World in Data
It can be observed from the above graph that the per capita electricity generated rose sharply from 6639.21 kWh in 2006 to 9521.38 kWh in 2007. Since then, the measure has been maintained between the 9000 kWh to 12000 kWh range, with a few ups and downs.
Interestingly, all of this electricity has been generated using a renewable source of energy, namely, hydropower energy, as can be observed in the image below.
Energy Consumption
With energy generation, it is also important to ensure that the said energy reaches the last mile for optimal growth and development of the economy. In this section, we shall uncover different measures of energy consumption, starting with access to electricity.
Access to Electricity
The definition used in international statistics adopts a very low cutoff for what it means to ‘have access to electricity’.
It is defined as having an electricity source that can provide very basic lighting, and charge a phone or power a radio for 4 hours per day.
The graph below shows the share of population with access to electricity since 2000.
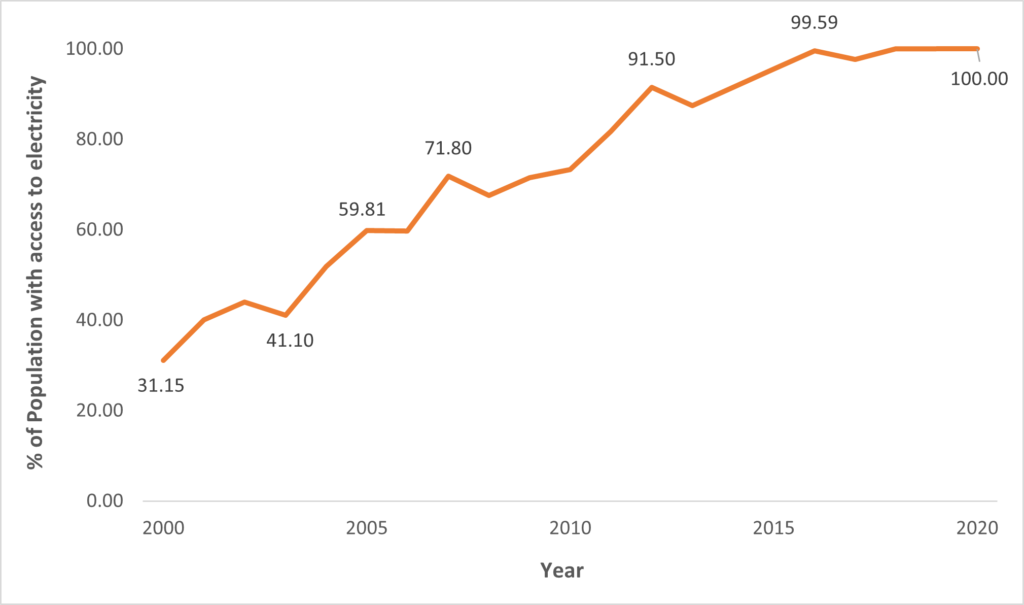
In 2000, 31.15% of the population had access to electricity. This figure increased to 100% per cent in 2020. On an average, between 2000 and 2020, 74.13% of the population had access to electricity.
Access to Clean Fuels
Access to clean fuels or technologies means access to natural gas, electricity, and clean cookstoves reduce exposure to indoor air pollutants, a leading cause of death in low-income households.
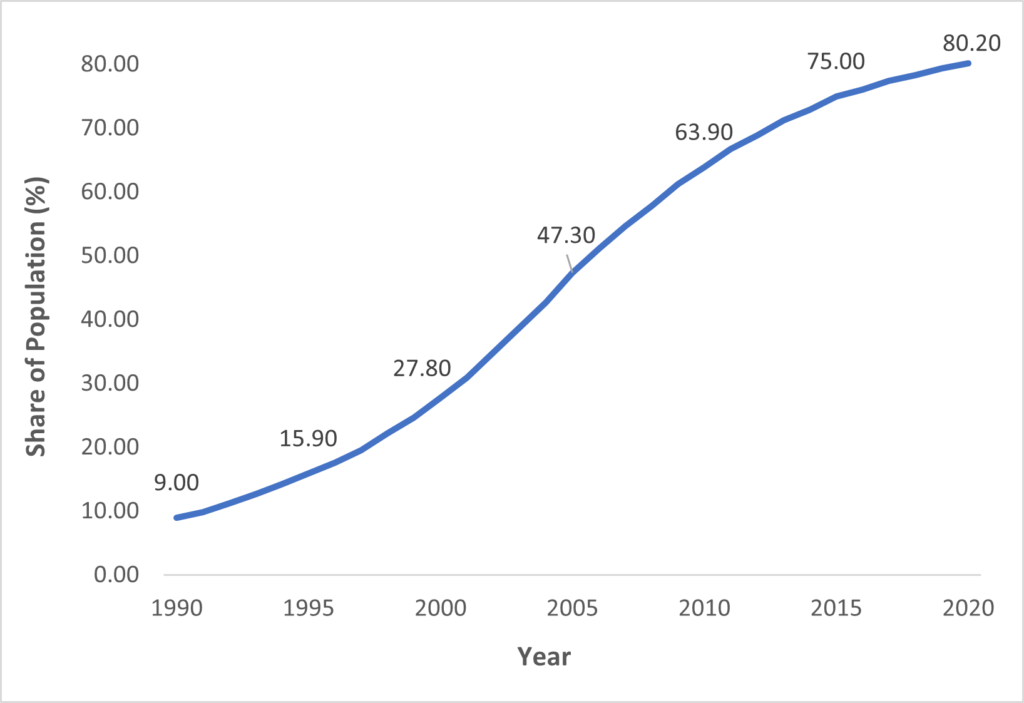
The image below charts the share of population with access to clean fuels for cooking between 1990 and 2020.
Share of population with access to clean fuels for cooking Source: Our World in Data
In the year 1990, only 9% of the population had access to clean fuels for cooking. By the year 2020, over 80% of the population gained access to clean fuels. An interesting trend the graph shows is that the increase in the share of population having access to clean fuels is smooth and consistent. There are no sudden upward or downward movements in the graph.
Per Capita Energy Consumption
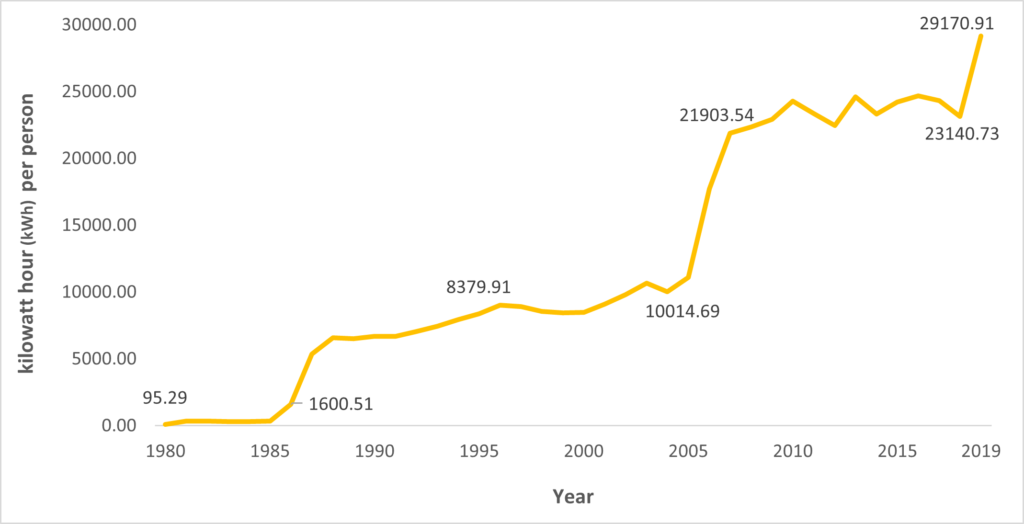
Per Capita Energy Consumption is calculated on the basis of total electricity consumed divided by the number of population in a country or region, giving per person usage of energy.
The chart below gives us an indication of the per capita energy consumption between 1980 and 2019. In 1980, 95.29 kWh of energy was consumed per person. By 2019, 29,170.91 kWh of energy was being consumed per capita.
This increase in per capita energy consumption is a testament to an increase in disposable income. With increasing incomes, households purchase more. For example, with increasing disposable incomes, households purchase larger appliances that consume more energy.
Primary Energy Consumption
Primary energy consumption measures the total energy demand of a country. It covers consumption of the energy sector itself, losses during transformation (for example, from oil or gas into electricity) and distribution of energy, and the final consumption by end users.
This section depicts the primary energy consumption by Bhutan, as a whole, between 1980 and 2019.
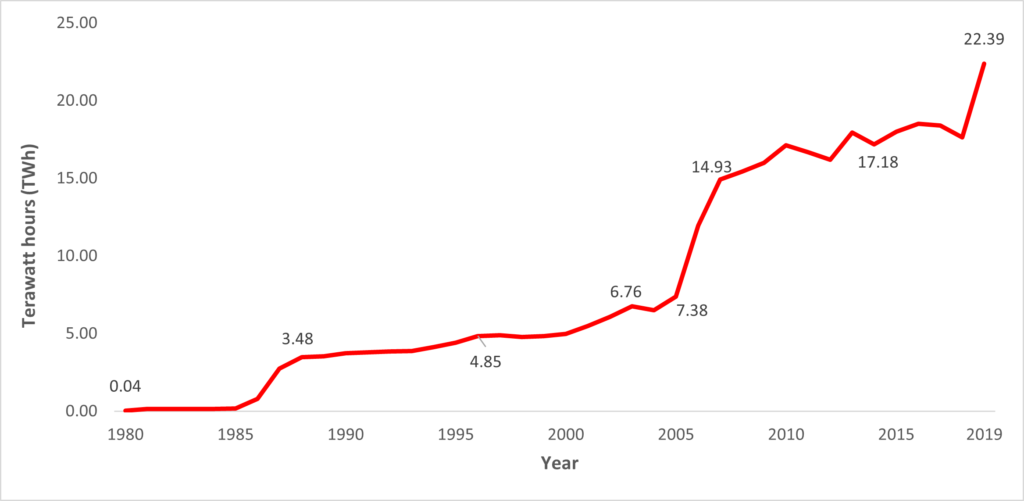
Within 39 years, from 1980 to 2019, Bhutan consumed 22.39 TWh of primary energy. The country’s energy consumption started gaining momentum in 2005. From 2006, probably with the signing of MoU between Bhutan & India to increase the scale of power projects from 5,000 MW to 10,000 MW, the country started consuming over 11 TWh of primary energy, and remained between the range of 15 TWh and 19TWh until 2018.
The following shows the year-on-year percentage change in primary energy consumption. When read in consonance with the above chart, one can understand the extent of change in significant years, for example, in 1986, 0.80 TWh of energy was consumed, which was a 387.65 percentage change from 1985. Similar is the case of other significant years, like 2006 and 2018.
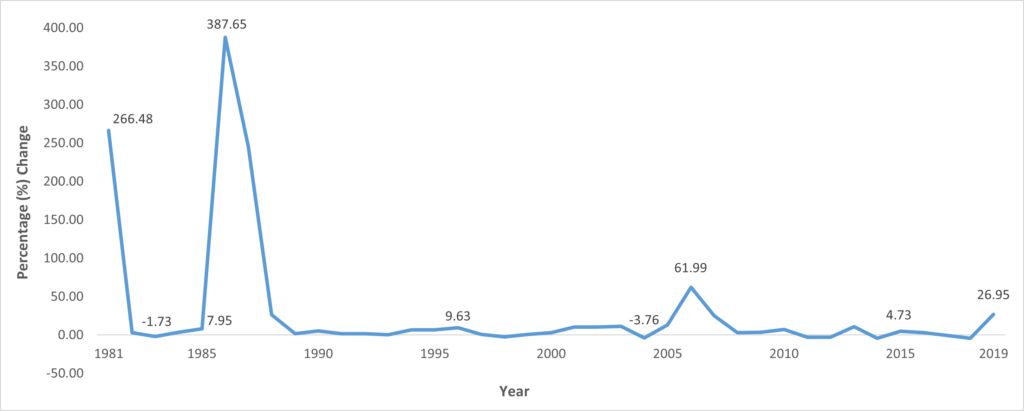
Source: Our World in Data
Primary Energy Trade
With respect to trade in electricity, Bhutan imported 84,000 MWh of electricity in 2016 (covering 4 per cent of its annual consumption needs), while it exported 5,763,000 MWh of electricity in 2016.
With respect to trade in energy, overall, Bhutan imported 8,386 terajoules (TJ) of energy in 2014 which increased by 14 per cent to 9,558 TJ in 2019. In the same period, Bhutan exported 19,218 TJ of energy in 2014, which increased by 18.5 per cent in 2019.
In 2014, it recorded a trade surplus of 10,832 TJ which increased to 13,231 TJ, recording a 22.1 per cent increase. In terms of energy trade, Bhutan experiences a trade surplus.
Energy Needs & Challenges
Bhutan is blessed with hydropower resources and has an estimated potential of 30,000 MW and 120 TWh mean annual energy generation indicating an average development potential of 781 kW in a square kilometer of area of land (catchment)(UN Studies). Rainfall in Bhutan tends to decline in the winter months, which is coupled with reduced melting that results into reduced river flow and limited hydroelectricity generation.However so far, Bhutan has been able to harness only 1.6 per cent of its total capacity.
In 2040, the energy demand in Bhutan (1774 GWh) will be about 2 times larger than the energy demand in the efficient scenario (830GWh). The percentage of energy sources in the efficient scenario by 2040 will be 60.8% electricity, 22.4% LPG, and 16.8% wood. The decrease in the percentage of wood and the increase in electricity consumption is mainly from switching from wood to electricity for space heating and cooking.
Speaking about rising energy demand and potential supply to associate with it, Loknath Sharma, Bhutan’s economic affairs minister said, “Currently, Bhutan produces around 2,345 MW during surplus time, when there is water. But that comes down to 500 MW in winter and that’s why we need to import from India,” on the sidelines of the India Energy Week conference in Bengaluru.
“More industries are coming to Bhutan therefore, we just want to have more solar in the mix over the next few years.,” Sharma said. He did not say who would finance and build the additional capacity.
Bhutan will add around 300 to 400 megawatts (MW) of solar energy generation capacity in the next two to three years to reduce its dependence on electricity imports from India. The Bhutan Renewable Energy Master Plan estimates that the country could produce 12 gigawatts of solar and 760 MW of wind energy. Yet the country’s current installed capacity for renewables, apart from large hydro plants, only amounts to 9 MW.
Way Forward
The Bhutan government has begun to subsidize electric vehicles as well as the cost of LED lighting has created various sustainable methods to maintain their Protected Areas which are the reason for their carbon sink.
The expansion of renewables can also contribute to the development of a more diversified electricity generation portfolio, which is resilient to changes in seasonal weather patterns and weather extremes that can adversely affect supply.
Renewable energy technologies can help strengthen Bhutan’s grid supply while reducing dependence on fuel wood and kerosene for cooking and heating. In doing so, they can complement hydropower, which has been central to providing electricity access in rural areas of Bhutan.
From a financial perspective, Bhutan already has electricity trade with India and draft procedural guidelines are in place for firms to participate in electricity trade. The country has a potential to use its renewable energy sources at optimum, while maintaining sustainability at its core and yet fulfill their increasing energy demands with technological, industrial and financial collaborations and partnerships.
In order to provide energy security to all its citizens, Bhutanese Government should undertake an evaluation study of the cost and benefit of various types of energy production and consumption. The cost-benefit analysis compares the costs and benefits of a project and then makes a decision on whether or not to proceed with the project. The project’s costs and benefits are measured in monetary terms after adjusting for the time value of money, thus providing a true picture of the costs and benefits.
The USA government with National Council for Research had undertaken a similar kind of study to explore potential avenues and also the damage that occurs with usage of energy.
The first part of the study should focus upon identifying the status of electricity production and consumption across the country either through secondary data collected by the government or through a primary survey. This would enable us to understand the demand which will have to match up with the supply of energy.
To estimate the supply side of the energy cost and benefit analysis of various types of energy production will be useful. It would provide financial estimates to help in setting up energy security initiatives in the country. The analysis of local demand and supply will highlight precise infrastructural, technological, and capital or investment needs.
The scientific evidence-based approach of calculating demand and supply of energy will lead to impactful output with minimum losses and yield maximum returns. As it takes into consideration the opportunity cost or best option available to achieve energy security for Bhutan as a nation.

Knowledge-sharing platform is aimed at providing analytical insights into Economy, Public Policy and Foreign Policy.
