
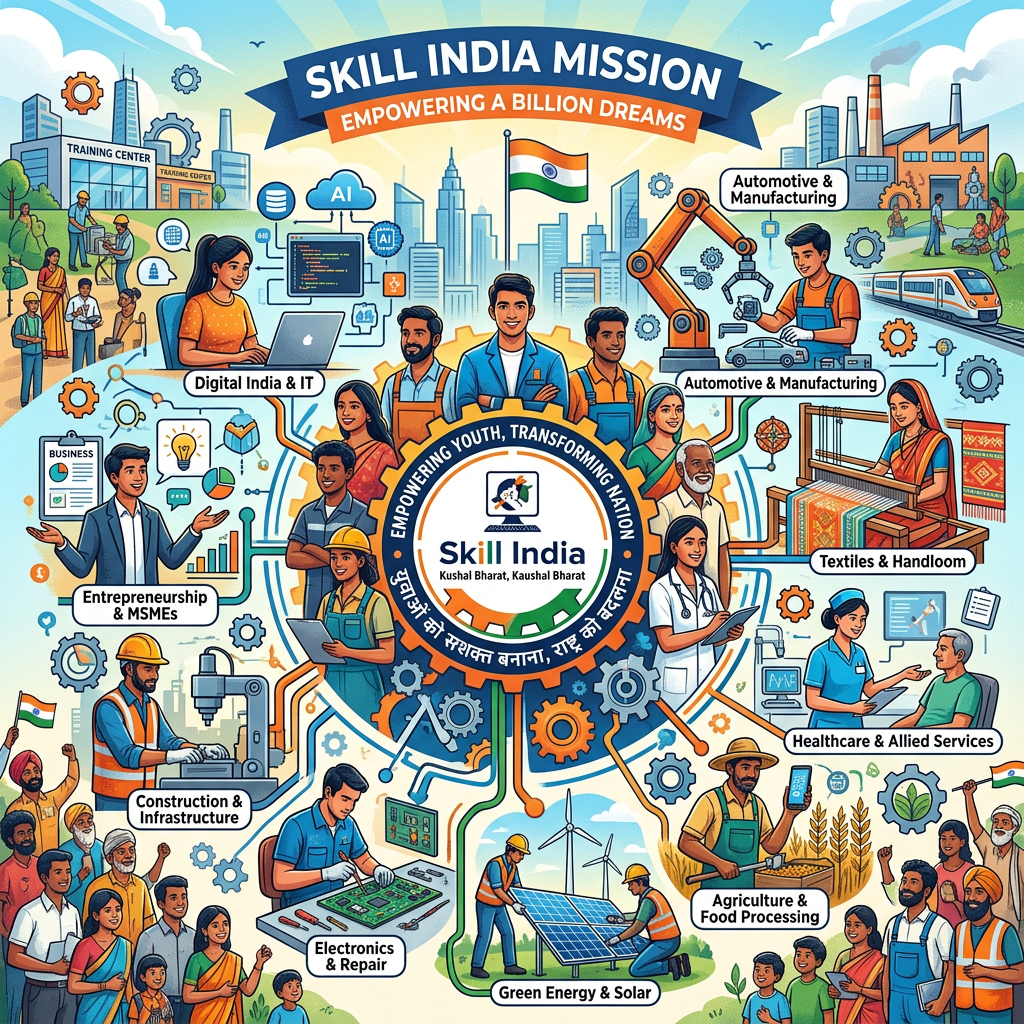
On 18 December 2025, India’s Comptroller and Auditor General tabled Report No. 20 of 2025 in Parliament. It covered all three phases of the Pradhan Mantri Kaushal Vikas Yojana (PMKVY) from July 2015 to March 2022: a combined outlay of Rs. 14,450 crore and a reporting record that successive governments had cited as evidence of India’s skilling transformation.
The headline finding was that of 56.14 lakh candidates certified under the scheme’s Short Term Training and Special Projects components, 23.18 lakh, or 41%, were placed. But the aggregate obscures a trend that is more troubling than the average. IDR’s January 2026 analysis of phase-by-phase placement data shows that the PMKVY 1.0 placement rate stood at 18.4%, rose marginally to 23.4% under PMKVY 2.0, and then declined sharply to 10.1% under PMKVY 3.0. The scheme was not converging toward better outcomes. It was diverging away from them. The official dashboard reported 50 to 55% throughout.
Independent tracer studies put sustained formal-sector employment at 15 to 25%. Labour force survey analysis puts it at 18 to 22%. This article examines what a decade of Skill India actually produced, why the architecture was built the way it was, and what structural changes the evidence demands.
What Skill India Built
The Skill India Mission, launched in July 2015, was an ecosystem of schemes rather than a single programme: PMKVY as the flagship short-term certification scheme, the Deen Dayal Upadhyaya Grameen Kaushalya Yojana (DDU-GKY) targeting rural poor youth, and the National Skill Development Corporation (NSDC) as a public-private intermediary. Each operated with a distinct funding model and primary output metric.
PMKVY’s design prioritised scale. Short Term Training courses ran 200 to 600 hours. The Recognition of Prior Learning component certified existing informal-sector skills without additional training. As Borah and Das (2025) document, PMKVY certified over 10 million individuals across more than 300 job roles across its first three phases, with cumulative enrolment crossing 17 million by late 2025. Against India’s National Skill Development Policy target of 40.29 crore skilled persons by 2022, PMKVY targeted 1.32 crore, less than 4% of projected demand.
DDU-GKY tied provider reimbursement to verified placement outcomes. The CAG report found this created its own perverse incentives: providers classified trainees who found any income-generating activity, including casual agricultural labour or return to family enterprises, as placed. The tension between the social inclusion mandate and the labour market realities of rural India was never resolved.
Table 1: Skill India Scheme Architecture and Measurement Regimes

What the Audit Found
The CAG report’s findings run across four dimensions.
Placement. Of 56.14 lakh certified under STT and Special Projects, 23.18 lakh (41%) were placed. But the phase-by-phase breakdown from IDR (January 2026) reveals the trend: 18.4% under PMKVY 1.0, 23.4% under 2.0, and a sharp decline to 10.1% under 3.0. The aggregate 41% figure, itself far below official claims, masks a trajectory that was deteriorating. In Kerala, training partners produced incorrect placement documents. In Uttar Pradesh, the Skill India Portal recorded 12,616 placements for which no record was found with the state agency. Only 13% of batches since 2018 complied with Aadhaar-based biometric attendance requirements.
Data integrity. 94.53% of PMKVY 2.0 and 3.0 beneficiary records had no valid bank account details on the Skill India Portal, meaning over 34 lakh certified candidates had not received their promised Rs. 500 reward payment. PMKVY 4.0 data reviewed in October 2024 showed repeated mobile numbers, 2.72 lakh null email addresses, and the same photograph used across different training batches in different states.
Sectoral mismatch. PMKVY’s own National Policy for Skill Development and Entrepreneurship projected high demand in construction, logistics, tourism, furniture and fittings, and beauty and wellness. These five sectors received only 22.7% of all trainings. Retail, electronics, and apparel accounted for over 40% of total STT/SP trainings against a projected demand share of 9.93%. No National Skill Development Plan was prepared under PMKVY 3.0 despite being required.
Financial management. Rs. 337.16 crore remained unutilised across states under PMKVY 3.0 as of July 2023. In Bihar, of Rs. 36.82 crore released, only Rs. 5.96 crore was utilised by March 2024. The Cabinet approved a further Rs. 8,800 crore in February 2025 to restructure the mission.
Why the Numbers Look the Way They Do
Three structural features explain the gap between what PMKVY reported and what independent evidence finds.
The first is the definition of placement. The reporting framework classified any post-training income-generating activity as a placement: casual daily-wage labour, return to family enterprises, short-term contract work. This eliminated the quality dimension entirely. The follow-up window of three to six months made it impossible to distinguish transient post-training employment from sustained labour market attachment.
The second is India’s informal labour market. Over 80% of India’s employment is informal. Mullan and Rolleston (2020) document that the mechanisms through which certification is supposed to improve outcomes, signalling productivity to employers and enabling credential-based wage bargaining, are largely absent in such a market. Singh, Yadav and Pradhan (2023) estimated the raw certified-uncertified wage gap at 5 to 12%, but found this narrowed substantially after controlling for education and prior work experience, becoming statistically insignificant in some specifications.
The third is the provider incentive structure. Private providers are reimbursed per trainee enrolled. Courses with lower infrastructure costs (retail, beauty, basic IT) are more profitable than courses requiring expensive equipment (advanced manufacturing, healthcare, construction). The sectoral mismatch the CAG identified is not a planning failure. It is a direct consequence of rewarding enrolment volume over labour market returns. Majumdar (2024) documents that a majority of employers are either unaware of NSQF credentials or do not use them in hiring decisions. When the credential has no labour market value, the market for it collapses to its cheapest form.
There is a fourth problem that aggregate certification figures conceal. The RPL component certified over 5 million workers by recognising existing informal-sector skills without additional training. As Borah and Das (2025) note, RPL certifications generate output statistics without producing outcome improvements: no new skills, no higher wages, no new employment. When RPL certifications are aggregated with STT certifications into a single national target, the programme’s scale appears larger than its actual human capital investment warrants.
Who Benefits and Who Does Not
Women constitute 40 to 45% of PMKVY trainees across schemes. But per Roy et al. (2023), over 70% of female enrollees are concentrated in beauty and wellness, apparel, and healthcare: the trades with the lowest post-training wages and weakest placement rates. Women certified in trades with limited labour market demand are counted as programme successes at certification and programme failures at placement, but only the former is systematically reported.
Training infrastructure is concentrated in district headquarters and urban clusters. Rural trainees face higher access costs before they begin training. SC and ST trainees who complete training through DDU-GKY’s reservation provisions face placement rates 10 to 18 percentage points lower than general-category trainees with identical course performance. Narayanan and Nandi (2017) find that fewer than 30% of rural-to-urban migrant trainees achieve sustained employment within two years of certification. The majority cycle between short-term urban jobs, return migration, and informal self-employment. For these trainees, the net welfare effect of certification, accounting for training costs, opportunity costs of time, and migration costs, may be negative. A programme that certifies equal numbers across social groups but delivers unequal labour market returns is not delivering equity, regardless of what the aggregate statistics suggest.
What Higher-Performing Systems Do Differently
The comparison with higher-performing vocational systems is useful not to copy their institutions but to isolate the design variable that India’s PMKVY lacks. That variable is financial accountability for employment outcomes.
The data from Germany’s dual vocational system is instructive as a benchmark, not a blueprint. Firms invest a net cost of approximately EUR 6,000 per apprentice per year after recovering the apprentice’s productive contribution during training. 74% of apprentices receive an employment contract from their training company upon completion. The overall VET graduate employment rate is 92.2%. These outcomes are not incidental to the system’s design: because employers co-invest financially, they have a direct stake in whether the trainee finds work. The risk of non-employment is distributed between employer and trainee, not concentrated entirely on the trainee as it is under PMKVY.
The more transferable lesson, however, comes from South Korea rather than Germany. Germany’s dual system required decades of institutional embedding that India cannot replicate on a compressed timeline. Korea’s post-1997 reform is instructive precisely because it started from a system structurally similar to India’s: supply-driven, government-funded, and provider-delivered. The reform’s core change was narrow but consequential: it shifted a portion of public training subsidies from enrolment-based grants to outcome-based payments, withholding reimbursement until the training provider demonstrated that trainees had secured and retained employment. Choi, Jeong and Kim (2019) document that this single structural change produced measurable improvements in both placement rates and wage returns, without requiring the wholesale reconstruction of the training system. That is precisely what India’s next phase of funding could do.
What the Next Phase Requires
The government’s response to three phases of deteriorating placement data has been, structurally, to stop measuring placements. PMKVY 4.0 was formally delinked from placement tracking after versions 1.0 to 3.0 showed poor placement figures. A March 2025 parliamentary panel report led by BJP MP Basavaraj Bommai explicitly called this out, stating that placement is the ‘real barometer for measuring the success of the scheme.’ PMKVY 4.0 has also fallen drastically short of its own certification targets: against a combined target of 120 lakh certifications across FY 2023-24, 2024-25, and 2025-26, only 18.76 lakh had been achieved by December 2025, a 15.65% achievement rate.
Table 2: PMKVY 4.0 Certification Targets vs Achievement (FY 2023-24 to 2025-26)

PMKVY 5.0 is now being formulated. The Sharda Prasad Committee has urged an outcome-based, demand-driven overhaul. Four reforms follow from a decade of evidence. First, relink provider reimbursement to independently verified employment outcomes at 12 months, not self-reported placements at 3 to 6 months: the Korean model demonstrates this is administratively feasible. Second, mandate district-level skill-gap analysis before allocating training targets. The CAG found that no National Skill Development Plan was prepared under PMKVY 3.0 despite being required; the sectoral mismatch was the direct consequence. Third, establish longitudinal trainee tracking at 6, 12, and 24 months post-certification, disaggregated by gender, caste, region, and training stream: without this, it is structurally impossible to know whether any phase of Skill India produces compounding career effects or a one-time placement statistic. Fourth, mandate employer co-design of curriculum through Sector Skill Councils: the NSQF’s credibility problem is not a branding problem, it is an employer engagement problem.
Conclusion
India’s PLFS 2025 records youth unemployment at 9.9% and graduate unemployment at 29.1%. The ILO India Employment Report 2024 finds that 83% of India’s unemployed are young people, and the share of agriculture in total employment actually rose again after 2019. India does not have a shortage of certified workers. It has a shortage of formal jobs that recognise and reward the certifications it issues.
The phase-by-phase data tells the story plainly: PMKVY’s placement rate fell from 18.4% to 10.1% across its first three phases. The government’s response was to stop tracking placements under PMKVY 4.0. The CAG concluded that selection of job roles without skill-gap analysis and assessment of market demands was a primary reason for low placements. That is a structural indictment. PMKVY 5.0 inherits Rs. 8,800 crore and the same architectural question its predecessors never answered: is this scheme built to count certificates, or to count jobs?
Author

Make Tatvita one of your preferred sources
See more insights from Tatvita Analysts in your Google Search results.



Leave a Reply