
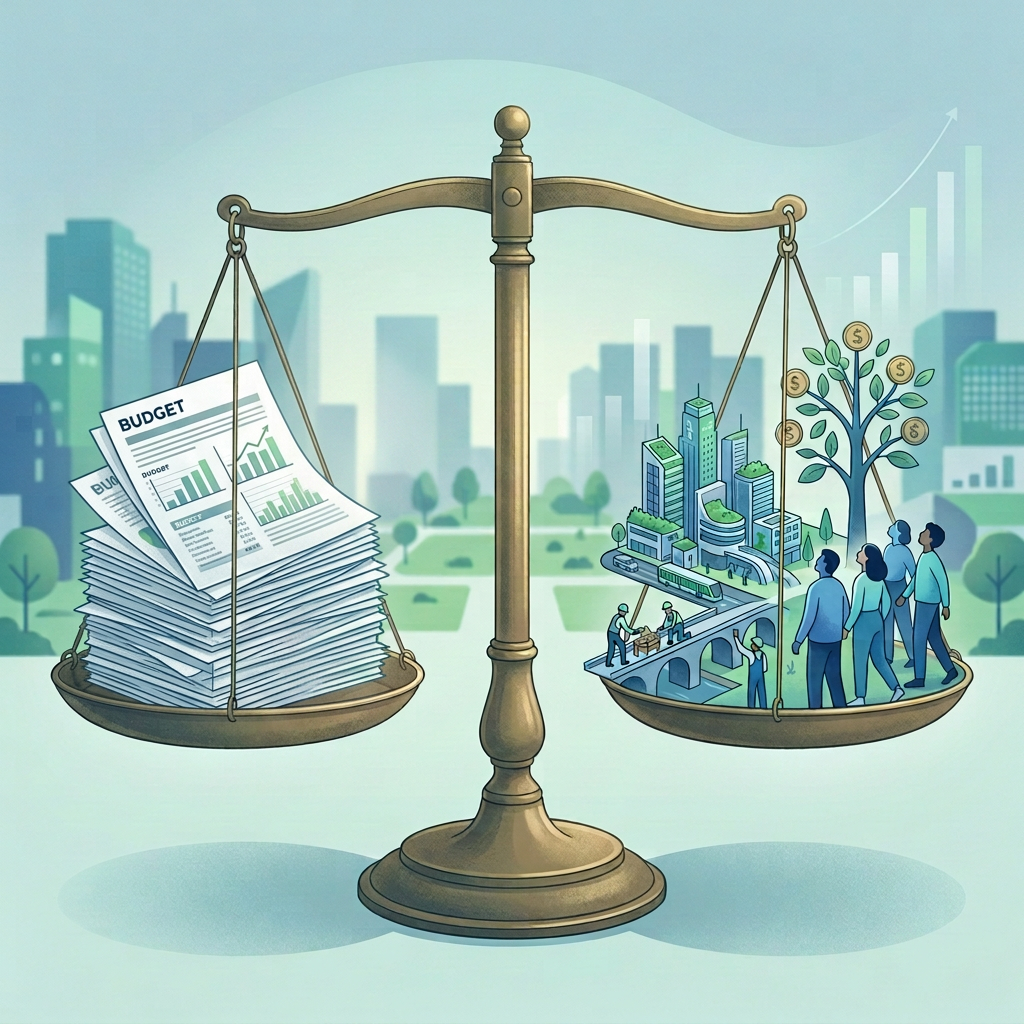
Every year, Indian state governments quietly handle all public spending in the country — schools, hospitals, roads, salaries, the works. Yet how much of that spending citizens can actually see and scrutinise varies enormously from state to state. Some governments publish detailed, accessible budget documents. Others release the scattered across reports few people ever read.
It raises an obvious question: does it matter? Do states that are more open about their finances actually end up managing money better?
A look at the numbers suggests the answer is “sort of, but not really” and the reasons why are more interesting than a simple yes or no.
What “transparency” means here
In 2020, Transparency International India scored Indian states on how open their budget processes were, on a scale of 0 to 100. The score combined four things: whether important budget documents were easy to find, whether citizens had a real say in the budget process, how well governments reported on spending after the fact, and any extra effort states made to present budgets in a citizen-friendly way (Transparency International India, 2025). That assessment was later reproduced and discussed by the International Monetary Fund, which found that only the Union government could be considered genuinely transparent — just four states (Assam, Andhra Pradesh, Odisha, and Jharkhand) reached even a “medium” level, while most others ranked low or, in nine cases, “opaque” (Blagrave & Gonguet, 2020).
The IMF’s broader point was that quantity isn’t the same as quality: a government can publish plenty of documents and still leave citizens in the dark if the information is scattered, delayed, or hard to parse (Blagrave & Gonguet, 2020).
What “fiscal health” means here
On the other side of the ledger is NITI Aayog’s Fiscal Health Index, a more recent measure covering 18 major states for the 2025-26 financial year. It scores states on five dimensions: how well they spend money (favoring capital investment over routine costs), how much revenue they raise themselves, how disciplined their deficits are, how much debt they carry, and whether that debt looks sustainable (NITI Aayog, 2026). It’s a deliberately broad measure, built on the idea that no single number; like the fiscal deficit alone, tells the whole story of a state’s financial health. Putting the two together-
Only seven states show up in both datasets in a way that allows a direct comparison: Odisha, Andhra Pradesh, Jharkhand, Bihar, Goa, Maharashtra, and Punjab. Lining up each state’s 2020 transparency score against its 2022–23 fiscal health score produces a mild positive relationship, a correlation of about 0.34. Run a simple regression and transparency explains roughly 12% of the difference in fiscal health scores between states. That’s a real pattern, but a weak one, and nowhere near strong enough to say transparency drives good fiscal management.
The state-by-state stories make it clear why.

Odisha is the standout example that fits the story neatly: relatively high transparency and, by 2023–24, the best fiscal health score of any state at 67.8, built on low deficits, a strong debt profile, and comparatively high capital spending (NITI Aayog, 2026).
Andhra Pradesh breaks the pattern entirely. It scored well on transparency back in 2020, yet its fiscal health score in 2023–24 was just 20.9 — near the bottom of the table. Whatever benefits openness might bring, they clearly weren’t enough to offset weak revenue collection and mounting fiscal pressure.
Jharkhand fits the expected story reasonably well: solid transparency, and a respectable fiscal health score of 51.6, aided by improving fiscal discipline and debt management.
Bihar had lower transparency and a correspondingly weak fiscal health score of 27.8 — though a single data point proves nothing on its own.
Maharashtra is a useful counterexample in the other direction. Its transparency score was comparatively low, yet its fiscal health score came in at a respectable 50.3, a reminder that a large, economically diverse state can lean on other strengths, like a broad revenue base, that have nothing to do with how transparent its budget documents are.
Punjab is the cautionary tale. Low transparency and the worst fiscal health score in the entire 18-state ranking, at 10.7, weighed down by a rising fiscal deficit and a debt stock that had climbed to around 46% of the state’s economic output (Reserve Bank of India, 2024).
Why transparency alone doesn’t cut it
The pattern that emerges isn’t “transparency causes good fiscal management.” It’s closer to “transparency is one ingredient among several, and not always the deciding one.” A state’s fiscal fortunes also hinge on how much revenue it can raise on its own, how much of its budget is eaten up by salaries, pensions, and interest payments before anything else gets spent, how much debt it’s already carrying, the underlying strength of its economy, and whether its financial administration has the basic technical capacity — reliable accounting systems, timely reporting — to manage money well in the first place (Blagrave & Gonguet, 2020).
In other words, publishing your numbers doesn’t automatically make them good numbers.
What would actually move the needle
If transparency alone isn’t enough, what would help? A few things stand out from the broader research on Indian state finances:
Governments could go beyond just posting documents online and instead focus on making them genuinely usable, timely, accessible, and written for citizens rather than accountants (Blagrave & Gonguet, 2020).
States could be more systematic about disclosing the fiscal risks that don’t show up in headline deficit figures: loan guarantees, off-budget borrowing, pension obligations, and the liabilities of state-owned enterprises. The Reserve Bank of India has specifically flagged this as an area needing improvement (Reserve Bank of India, 2024).
Budget credibility matters too, publishing not just what a government plans to spend, but following up with what it actually spent, so citizens and analysts can see how realistic the original plan was.
None of this works in isolation. Transparency is more useful when it’s paired with real fiscal rules and consequences for missing them, and when there’s a standardized way to compare one state’s finances to another’s; something groups like PRS Legislative Research have been pushing to compile more systematically (PRS Legislative Research, 2025).
The honest caveat
This comparison only covers seven states, matched imperfectly across two datasets built for different purposes in different years. The transparency scores are read from a published chart rather than a raw dataset, and two years separate the transparency assessment from the fiscal health scores. None of that is enough to prove causation — a state could simply be well-governed in ways that produce both transparency and fiscal health, without one causing the other. A more rigorous version of this analysis would track more states over more years and control for things like per-capita income, revenue capacity, and existing debt load before drawing conclusions about transparency’s independent effect.
The bottom line
Transparency looks like it helps, a little. But it’s not a silver bullet. The states that manage their money well tend to combine transparency with things that matter more directly; solid revenue collection, disciplined spending, and manageable debt. Openness makes problems visible. It doesn’t, by itself, fix them.
Author

Make Tatvita one of your preferred sources
See more insights from Tatvita Analysts in your Google Search results.

Leave a Reply