
In 1962, South Korea launched its first national family planning programme. Its Total Fertility Rate (TFR) at the time was 6.3. Over the next two decades, the government paired declining fertility with compulsory primary education, targeted public health investment, and a deliberate push to bring women into the formal workforce.
By 1985, the TFR had fallen to 2.2, and by the late 1980s South Korea had doubled its national savings rate. Demographers estimate that the demographic dividend alone raised output per effective consumer by about 34% over forty years, contributing one-third to one-half of the broader East Asian economic miracle.
The dividend became a burden. The window, once closed, did not reopen.
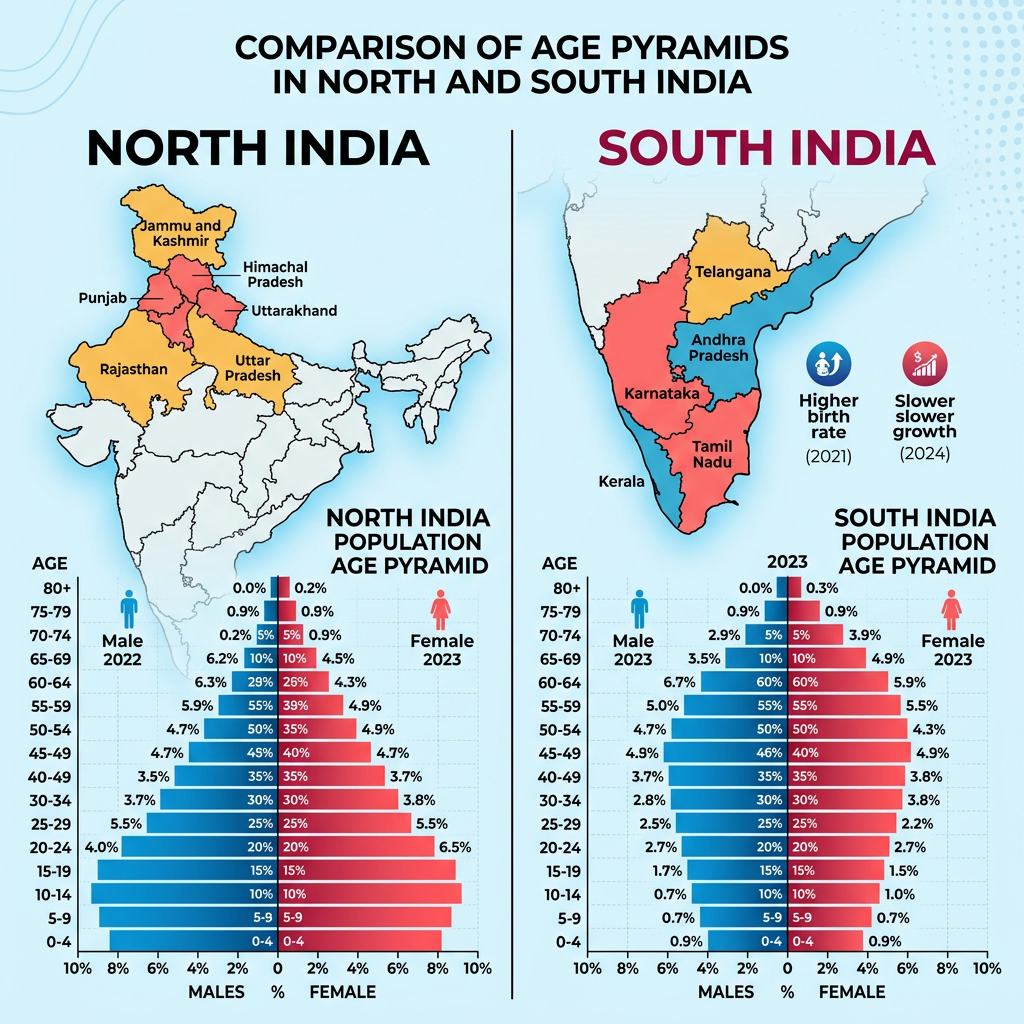
India has surpassed China to become the world’s most populous country, yet its demographic transition is no longer uniform. While southern states are beginning to confront ageing and labour shortages, several northern states still have fertility rates above replacement. This divergence means India is not managing one demographic transition, but several unfolding simultaneously.
In May 2026, the SRS Statistical Report 2024 confirmed India’s national TFR at 1.9, below replacement for the fifth consecutive year. Bihar’s is 2.9. Tamil Nadu’s is 1.3. The national average conceals two demographic worlds travelling in opposite directions, sharing the same constitution and the same currency.
Whether the dividend materialises or becomes a trap depends almost entirely on what happens in the states that have not yet arrived.
How Demographic Dividends Are Created
The demographic dividend arises when a decline in TFR reduces the number of youth dependents relative to the working-age population. This lowers the dependency ratio, freeing up household savings and allowing greater public and private investment in human capital. Peer-reviewed analysis of India’s case estimates that India’s demographic window opened around 2005 and extends to approximately 2055, with the working-age share peaking around 2041. Between 1981 and 2015, the dividend contributed an estimated 1.9 percentage points to India’s annual per capita income growth.
But this is the first demographic dividend: the mechanical gain from a larger share of workers relative to dependents. The UNFPA is explicit that it only translates into sustained growth if labour productivity also rises. A growing working-age population that enters low-productivity, informal, or agricultural employment does not deliver the dividend. It defers it, and risks losing it entirely.
The structural warning is already visible. The ILO India Employment Report 2024 found that 83% of India’s unemployed are young people, and the unemployment rate for graduates stands at 29.1%, nine times higher than for those who are illiterate (3.4%). The slow transition away from agricultural employment stalled after 2019, with the share of agriculture in total employment actually rising again. The PLFS Annual Report 2025 records female labour force participation at only 40% nationally. This is the national picture. The state-level divergence is sharper still.
One Country, Two Demographic Realities
The Economic and Political Weekly (June 2026) puts the structural break plainly: all six states that remain above replacement fertility belong to the Empowered Action Group (EAG), the cluster of historically lagging states. Every state outside this group is now at or below 2.1. Bihar’s natural growth rate, the difference between its birth and death rate per thousand, stands at 20.8. Kerala’s is 3.9. Tamil Nadu’s is 4.8. Business Standard’s analysis of the SRS data notes that Bihar and UP’s natural growth rates are four to five times higher than those of Kerala and Tamil Nadu.
The timeline of this divergence matters as much as the numbers themselves. Data for India shows that Kerala crossed replacement fertility in 1988, when India’s national TFR was still 4. Tamil Nadu followed in 1993. Bihar is projected to reach it in 2039. By then, Tamil Nadu will have spent nearly half a century below replacement. The SRS data also shows that literate mothers nationally have a TFR of 1.8 compared to 3.2 for illiterate mothers. But urbanisation, female employment, and social norms are doing as much work as education: even among graduates, Bihar’s TFR (2.2) exceeds Delhi’s (1.6).
Table 1: Fertility, Growth, and Child Health Across Key States (SRS 2024 Data)

When Population Growth Becomes a Trap
Bihar has the lowest per capita NSDP of any major Indian state at Rs. 69,321 as of FY 2024-25, per the RBI Handbook of Statistics on Indian States 2024-25. Telangana’s is Rs. 3,87,623. A 2024 EAC-PM working paper found that Bihar, which held 7.8% of India’s GDP in the early 1960s, has seen its relative per capita income fall and stabilise at a fraction of the national average.
The employment gap reinforces the income gap. The ILO Employment Report 2024 found that Bihar and UP ranked at the bottom of its Employment Condition Index across every survey year from 2004 to 2022, while Tamil Nadu and Telangana remained at or near the top. Formal, regular employment as a share of the workforce is significantly lower in EAG states. This is the causal chain the trap thesis rests on: high population growth adds labour supply into economies that have not built the formal employment base to absorb it productively.
The human capital deficit compounds the income gap. UP and MP have Infant Mortality Rates of 37 per thousand live births, comparable to Sudan according to Data for India. Bihar’s is 25. Over half of India’s infant deaths are concentrated in UP, Bihar, and MP, with UP accounting for one in three. Children who survive infancy in these states enter weaker education systems and narrower formal labour markets.
Table 2: Per Capita Income and Poverty Divergence Across Key States (FY 2024-25)

The South’s Different Problem
Southern states face the mirror-image challenge. Tamil Nadu’s 0-14 age group is only 18% of its total population. Bihar’s is 31.5%. Fifteen percent of Kerala’s population is now over 60, the highest in India. Tamil Nadu’s 60-plus share rose from 10.6% to 14.2% between 2014 and 2024.
A Carnegie Endowment analysis (April 2026) categorises these states as India’s ‘Ageing Frontier’: they must redirect fiscal resources toward geriatric and long-term care while sustaining the economic productivity that funds those services. Their dividend is in its mature phase. The question for them is how to maintain productivity as the workforce shrinks.
The two realities are connected by internal migration: EAG states already export large numbers of workers to richer states, partially converting demographic pressure into remittance income, but migration alone cannot substitute for structural transformation in sending states, since remittances remain largely consumption-oriented and migrants are absorbed predominantly into informal work.
Table 3: Regional Demographic Profiles and Policy Implications

The Political Economy of Divergence
The demographic gap has a constitutional dimension that is now a live political crisis. India froze parliamentary seat allocation based on the 1971 Census to avoid penalising states that had reduced fertility. That freeze, extended through the 84th Amendment to 2026, is now being lifted. The Delimitation Bill 2026, introduced in a special Parliament session in April 2026, proposes to expand the Lok Sabha to 850 seats and reallocate on the basis of the 2011 Census.
PRS Legislative Research projections show that Uttar Pradesh gains seats from 80 to 89, Bihar from 40 to 46, Rajasthan from 25 to 30. Tamil Nadu falls from 39 to 32, Kerala from 20 to 15. Carnegie Endowment analysis estimates this shifts 43 parliamentary seats northward while southern states lose 24. The grievance against it is not merely political: the states that invested most heavily in health and education over five decades stand to lose voice in the parliament that decides how such investments are funded nationally.
Converting the Potential: Policy Imperatives
Because India’s demographic transition is increasingly regional rather than national, these policy responses cannot be uniform. States at different stages of the transition require different priorities.
Education and skill quality. The quantity of India’s youth cohort is not in question. The quality is. The ILO Employment Report 2024 documents the mismatch between the credentials the education system produces and the skills the labour market demands. The New Education Policy addresses learning gaps in principle, but implementation at scale in EAG states, where school infrastructure and teacher quality remain weakest, is the actual test.
Labour-intensive manufacturing. The agricultural sector, which has historically absorbed surplus labour, is losing that capacity. Non-farm formal employment has not grown fast enough to compensate. Industrial policy in EAG states must prioritise labour-intensive manufacturing, food processing, and light industry that can absorb the semi-skilled workers the formal sector is currently bypassing. Infrastructure investment, particularly in roads, power, and logistics, is a prerequisite.
Female labour force participation. The PLFS 2025 records national female LFPR at 40%, an improvement but still far below what a genuine dividend requires. Policies that address safety, provide childcare support, and challenge norms restricting women’s economic roles are not welfare measures. They are the most direct lever available to convert population size into productivity.
Health convergence. UP and MP’s IMR of 37 is not only a humanitarian failure. It means the future workforce is being depleted before it enters the labour market. Reducing child mortality through primary and maternal healthcare investment is a direct economic input. Kerala’s IMR of 8 and life expectancy of over 75 years did not happen by accident: they were the result of decades of consistent public health spending that the EAG states have not yet replicated at comparable scale.
Conclusion
India’s demographic future will not be decided by the size of its population, but by the productivity of the people entering its workforce.
Bihar’s 0-14 age group is 31.5% of its population. Tamil Nadu’s is 18%. South Korea’s experience shows what the right side of that transition looks like: 34% growth in output per effective consumer over forty years, built on education, health, and female employment investment. It also shows what comes after: a TFR of 0.75, a shrinking workforce, and a demographic burden that no policy has yet reversed. The south is beginning to face that second chapter. The EAG states are still deciding whether they will reach the first.
The Carnegie Endowment (2026) frames the stakes precisely: India’s demographic dividend is a test of governance, not a guarantee of growth. The dividend and the trap are not alternatives facing different countries. They are alternatives facing the same country, depending on decisions made in the next fifteen years in Patna, Lucknow, and Bhopal. The window is open. Whether it is used is a policy choice.
Author

Make Tatvita one of your preferred sources
See more insights from Tatvita Analysts in your Google Search results.


Leave a Reply