
BSE Sensex in India has increased by 37% during Kargil War. GDP growth remains unchanged at 8.85%. On paper, 1999 was a good year for the Indian economy.
In the Kargil district, thousands of families were displaced. Local trade collapsed. The pastoral nomads of Ladakh, who rely on the movement of livestock across the LOC, had been deprived of their grazing lands for good. The episode failed to register in either national accounts or financial market indicators, remaining outside the scope of conventional measurement systems.
This is the central problem of conflict economics: the numbers that governments and analysts rely on GDP, inflation, investment are not built to see the people most affected by war. They are used to measure the economies at the national level. Wars affect individuals within the household, the community and at the local level. It’s the difference between those two that’s where the real damage lies, and where policy decisions go wrong.
This is the central problem of conflict economics: the numbers that governments and analysts rely on, are not built to see the people most affected by war. They are used to measure the economies at the national level. Wars affect individuals within the household, the community and at the local level. It’s the difference between those two that’s where the real damage lies, and where policy decisions go wrong. It measures goods production, services sold and money spent in formal markets, by registered entities, collected by working statistical agencies. All of those conditions are violated by war.
Statisticians evacuate or shut down offices. Companies in war areas cease to submit tax returns. There are areas where displaced populations are not accessible for surveys. There’s a difference in prices: One litre of petrol can be three different prices at a petrol station, at a black market and at a military supply chain. In a nation where much of economic activity is already informal, anyway as is the case for most of South Asia the official statistics were already missing a vast part of the economy before the first bullet was fired.
What GDP does measure during conflict, it often measures wrong. GDP measures what in times of conflict, it measures. Military spending is included in the production of goods and services. Bombing does not detract from GDP, it’s reconstruction. Once destroyed, it doesn’t deduct. The data shows growth from a city that has been bombed and rebuilt. This is not a conspiracy, but rather what the metric was meant to do. However, GDP is a very misleading measure of improvement or deterioration in people’s lives.

Conflict produces persistent macroeconomic scars, where GDP, trade, and consumption remain structurally below baseline even a decade after onset, indicating long-term economic hysteresis rather than temporary shocks.
Kashmir, the Northeast, and the Invisible Economy
The statistical system of India is one of the best in the developing countries. However, its fault lines are most evident in its conflict zones. For more than three decades, Jammu and Kashmir has been in the state of conflict. The economic losses are tangible and significant but they are underestimated. In 2016, 168 curfews were enforced in nine districts; no curfews were imposed during 2015. The official report of the J&K government itself admitted that on that year, the losses were at ₹16,000 crore. A communications blackout in 2019 interrupted business activity for almost 214 days. The decision to pull back Article 370 in August 2019 made a dent on the local economy with an estimated loss of ₹17,878 crore and total investment in J&K was reduced to $36.3 million in 2019-20, which was a year before the pandemic started. This is not reflected well in national GDP. J&K’s share at the national level is small. Its own losses become part of the total of the Nation and vanish.
The problem goes beyond the numbers. Owing to the sparse statistical record, policy interventions are tuned to what can be measured. Infrastructure investments, allocations of subsidies, and development schemes are allocated according to data — but if the data is not available for a region, or is not accurate, then that region receives less.
This is even more evident in the northeast region of India. The insurgencies in the eight northeastern states have been active since the 1950s. Between 2024, there were 266 insurgency-related incidents in the region, 203 of which occurred in Manipur, displacing 60,000 people and resulting in 258 deaths. The ethnic conflict between Meitei and Kuki community in Manipur is ongoing in 2023. These are not insignificant figures. The Northeast is, however, not only responsible for 18% of India’s GDP at independence, but has shrunk to just 2.8% in 2009 largely as a result of decades of conflict, instability and under investment.
Who Gets Excluded When the Data Is Wrong
- Internally displaced people: These are one of the most economically poor groups of people in any conflict and are typically undercounted. Household surveys are usually conducted on households that have regular addresses. Camp residents, family members and residents of informal settlements are consistently excluded. When they are missed in surveys, they are missed in policy. The individuals who are most in need of food subsidies, housing programmes and employment schemes, based on the survey data as eligibility criteria, are not included.
- Women and informal workers: Formal jobs are first affected during wars. However, in times of conflict women tend to persist in their roles in informal agriculture, home based production and care which is outside of GDP. Conventional reconstruction programmes that are based on the concept of ‘economic recovery’ usually refer to the restoration of formal jobs and formal production. Women, who have been mainly responsible for earning a living throughout the conflict, in an entirely informal economy, are not included in the scope of all the programmes formulated for them.
- Minority and tribal communities: Minority and tribal communities in border areas are the most vulnerable to this issue. In the Indian northeast, which has 200+ ethnic groups with land and political claims, communities the most distant from administrative centres are least likely to be present in any dataset. The distance grows even larger in conflict. Development resources go to statistics that are visible. The voiceless groups remain unmentioned.
Under prolonged violence, inequality is quite often exacerbated: not only by the damage that happens, but also with the ability for wealthier and more politically influential groups to evacuate to safer areas, access formal finance systems, and re-enter the statistical record once the conflict is over. Poorer families are permanently denied access to formal systems, especially those in rural areas. The average recovery is getting better, but there is more variation between those who recovered and those who did not.

How Economists Are Trying to Rebuild the Picture
Satellite imagery at night:
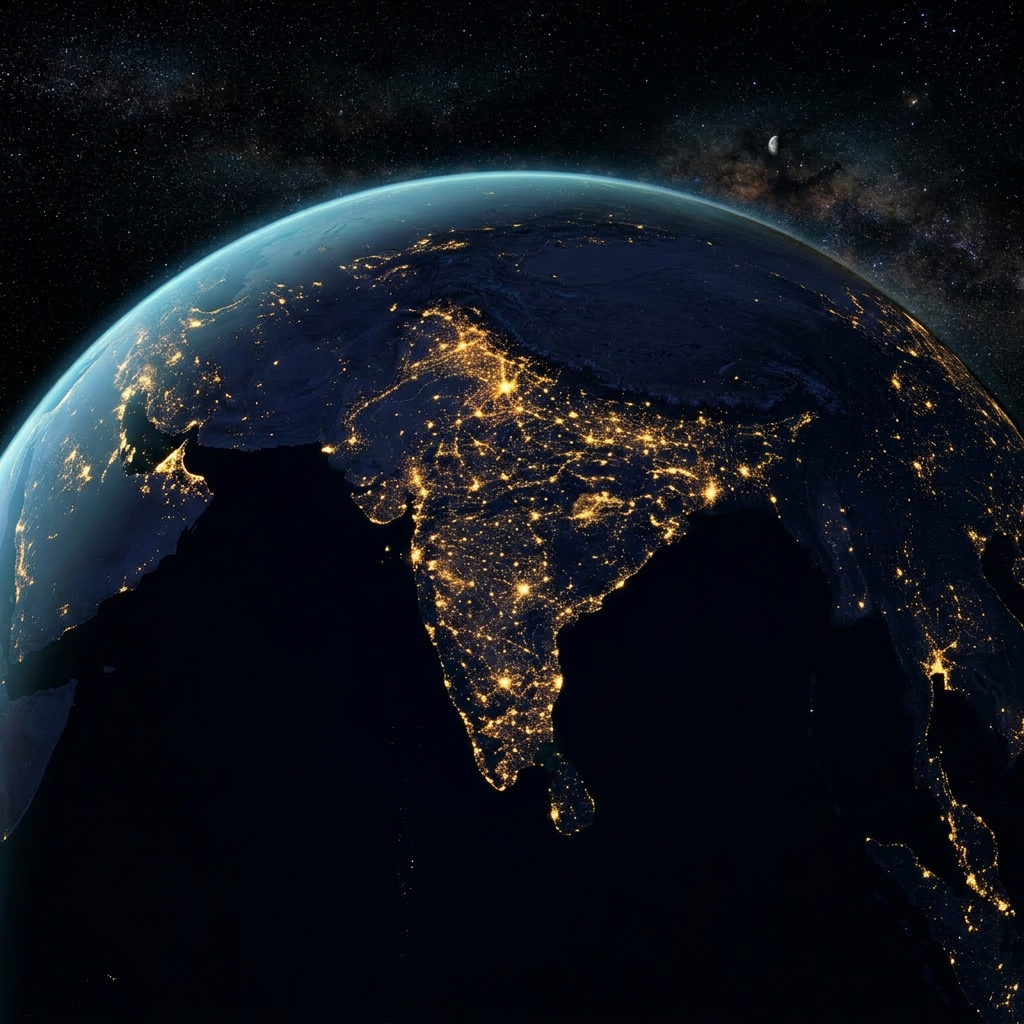
This has emerged as the most popular indicator of economic activity in conflict areas. The principle is simple: economic activity produces light. Factories operate, markets are open, buildings are illuminated by generators. Satellites that take nighttime photos of Earth can see changes in the light emitted at the district or even village level, providing economists with a real-time, continuous view of where activity is taking place and where it’s going dark. This approach, for instance, uncovered Afghanistan’s civilian economy in 2023 was 10.5% brighter than it was prior to the Taliban’s takeover, despite the official GDP data indicating a 25% decline. Much of the disparity was attributed to the closure of foreign military bases that had been pumping artificial light into some areas that was unrelated to local economic activity.
High-frequency digital data:
Economic changes can be tracked via data such as mobile payments, Google search trends, e-commerce activity, electricity consumption, and more. In the Ukraine war, researchers used satellite data, social media and search activity to estimate a 45% drop in economic output at the beginning of the war, but a recovery to 85% of pre-war levels by April 2022. These tools would not have been available otherwise, and that recovery would not have been apparent for months or years until official data was collected. Synthetic control methods create a “comparison country” that is a weighted average of similar, non-affected economies, to estimate the economy of the conflict without the war. Humanitarian agencies’ administrative information, such as food distribution registers, medical records, and surveys of displacement camps, is an unintended economic database in conflict areas. Aid agencies see populations that statistical offices cannot reach. They can help to fill in missing information on consumption, health and movement, if used properly, in their records.
None of these tools is a substitute for a working statistical system. Combined, they provide a much more reliable picture than official national accounts, however, for policymakers.
Policy design in conflict affected areas needs to shift from depending on fully functional statistical systems to developing resilient administrative and data systems that remain functional in the face of partial territorial control, survey disruption, and high informality. This helps to prevent the collapse of essential welfare delivery, reconstruction planning and resource allocation due to the lack of or disruption of traditional data collection methods.
Author

Make Tatvita one of your preferred sources
See more insights from Tatvita Analysts in your Google Search results.


Leave a Reply