
Exposure of Inflation on Our Life
In Economic Theory, we learn that individuals or households consume goods & services even if the income is zero. This highlights the importance of consumption as an economic function in our everyday’s lives.
Further, to drive the demand cycle of the economy, consumption is supported by willingness to pay plus ability to pay for goods & services.
And, people across the world are struggling under the weight of hefty price increases for the things they buy each day. This is because of the rising levels of inflation.
Inflation refers to the rate of increase in prices over a given period of time. The currency of any given country buys less than it did in previous times.
Countries with the highest inflation rates often find it difficult to afford basic necessities such as food prices, energy costs, and clothing.
Impact
Impact of inflation is witnessed on everyone’s daily lifestyle.
When inflation rates get higher than wage growth, it can cause severe economic complications. If the money in any given country is worth less and people aren’t earning enough to keep up with the difference, the regular supply chain and demand are impacted. This is when people cannot afford basic living expenses.
Inflation impacts all aspects of the economy from consumer spending to government programs and interest rates. Consumer Price Index (CPI) is an essential tool for RBI as it looks after the monetary policies of the country. The framework by RBI requires it to keep the inflation rate around 4% however it can fluctuate anywhere between 2% and 6%. The primary motive of RBI is inflation control, while it may change from time to time depending on the decision of the monetary policy committee.
The MPC holds its meeting to decide the repo rate in the economy. Repo rates are decided in tandem with the inflation rate of the economy.
If the general price level prevailing is rising in such a situation, to arrest inflation, the central bank would want to reduce the money supply in the economy. For this RBI may increase repo rates, which will make it difficult for the banks to borrow money from the RBI, ultimately reducing liquidity in the economy.
Understanding inflation around the world is crucial because inflation can reduce the value of investment returns. Calculating inflation-adjusted returns is extremely important because it tells the real value of an investment and if the money has grown in real terms or not. Say your investment gave you 3% returns per annum over a period of time and the value of money, which is inflation, also rose 3.5%; net-net your investment’s returns get nullified. The reason being, the value of money also rose. Hence, it is important to spot inflation-beating investment instruments.
Global Outlook
Global headline inflation is expected to fall from 8.7% in 2022 to 6.8% in 2023 and 5.2% in 2024.
The rise in central bank policy rates to fight inflation continues to weigh on economic activity. Underlying (core) inflation is projected to decline more gradually, and forecasts for inflation in 2024 have been revised upward by the International Monetary Fund (IMF).
Higher energy costs in the second half of 2023, tight labour markets (number of job openings available exceeding number of workers available) that drive up services inflation, and ongoing globalisation reset which could offset some of the efficiency gains in the global supply chains are among the key risks that could increase inflationary pressures in 2023-2024.
Sustained faster economic growth in China could also lift demand for commodities and increase supply-side inflationary pressures in the second half of 2023.
According to the IMF, there are 40 countries, including the UK with the highest forecasted inflation rates in 2023.
The IMF said that the high inflation at 9% is projected in 2023 as “lower purchasing power and hawkish monetary policy drag on the economy”. With a 204% forecasted inflation rate, Zimbabwe’s inflation rate is highest in the world. IN 2020, inflation stood at 557%.
Visual Capitalist reported that the aforementioned countries fight to sustain their purchasing power, and other countries will continue to fare exceptionally well against the backdrop of a widespread cost of living.
For instance, countries like Taiwan, China, and Japan are all predicted to see inflation lower than 3% this year. The IMF has projected a 5.1% inflation rate for India in 2023 and for the US at 3.5%.
Indian Experience
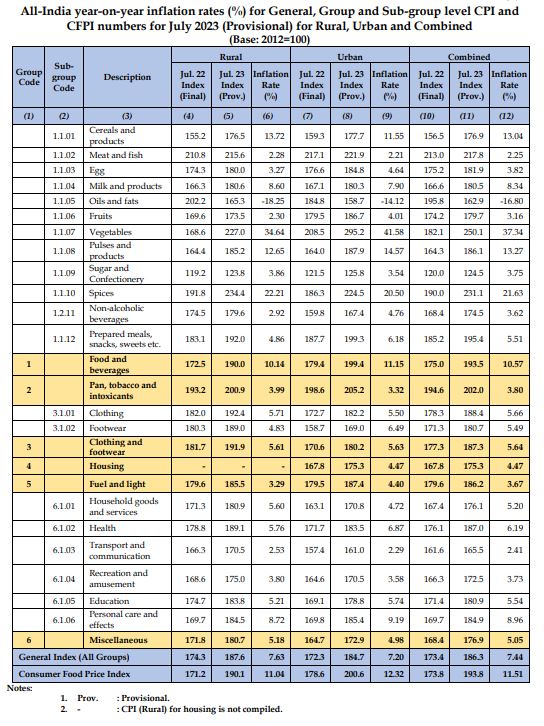
Government of India’s data released on 14th August 2023 showed that the country’s consumer price index (CPI) inflation surged sharply to a 15-month high peak of 7.44% in July 2023, driven by high food and vegetable prices.
Some food items, especially essentials like vegetables, grains, and dairy, tend to have relatively inelastic demand. This means that changes in their prices lead to disproportionate changes in overall spending, as people cannot easily reduce consumption even if prices increase.
As a result, food inflation can quickly affect household budgets and lead to decreased purchasing power.
If inflation stays elevated for the next two quarters, the central bank will likely hike rates in the near-term.
State-wise Inflation Rates
The inflation experience has been grounded across India. The results show that Goa and a few North-Easterns states have an inflation rate around 2% to 4%. Otherwise, the majority of Indian states have an inflation rate around and more than 6%.
Consumer Price Index (CPI) : Measuring Inflation
The National Statistical Office (NSO), Ministry of Statistics and Programme Implementation (MoSPI) releases All India Consumer Price Index (CPI) on Base 2012=100 and corresponding Consumer Food Price Index (CFPI) for Rural (R), Urban (U) and Combined (C)
The Price data are collected from selected 1114 urban markets and 1181 villages covering all States/UTs through personal visits by field staff of Field Operations Division of NSO, MoSPI on a weekly roster. During the month of July 2023, NSO collected prices from 99.5% villages and 97.8% urban markets while the market-wise prices reported therein were 85.8% for rural and 89.7% for urban.
CPI measures the change in the price level of goods consumed by retail consumers, who are on the demand side of the economy. For the same reason, it can be interpreted that CPI measures the purchasing power of an economy’s currency.
CPI is calculated for a fixed basket of goods and services that may or may not be altered by the government from time to time. Basket weights show the relative importance of the various goods and services in the overall CPI basket. The items in the basket are weighted according to consumer expenditure patterns. For example, Indians spend a much larger share of their total budget on rent than milk: thus a 10% increase in rental rates will have a greater impact on the All-items CPI than a 10% increase in the price of milk.
Items for the CPI basket of goods and services are classified across categories such as:
- Food and Beverages;
- Pan, Tobacco and Intoxicants;
- Clothing & Footwear;
- Housing;
- Fuel and Light;
- Miscellaneous.
The consumer price index is calculated as a percentage. It is a comparison of the general price level in the markets in a particular time period from a time frame in the past. This is known as the base year. CPI, therefore, is calculated by referring to a base year which is a benchmark.
The base year is monitored by the Central Statistics Office (CSO), Ministry of Statistics and Programme Implementation (Mospi), and changes from time to time. Last, the base year was shifted to 2012 from 2010. This was effective from January 2015 onwards.
Currently, the consumer price index (CPI) is calculated by taking into consideration 299 items.
CPI is also used for indexing Dearness Allowance (DA) to employees for increase in prices.
The Consumer Price Index for a given centre is compiled by using the Laspeyres’ base weighted formula. The formula in its aggregative form is expressed as below:-

where I n is the index for a given period (current month), p o and p n are base and current prices respectively of an item, q o is the quantity of that item consumed in the base period and the summation ‘Σ’ extends over all the items included in the index. The formula can be expressed as:-

where the expression p n / p o is the price relative (PR) of a given item and q o p o which in fact, is the expenditure on that item in the base period, comes out as the weight for the price relative (p n / p o) for averaging the price relatives of all the items included in the index. The price-relative for a given item is the ratio of average price of the item for the current month to the corresponding base price.
Elementary Calculation

“Index reference period” is the period for which the value of the index is set at 100.0.
The base period is also referred to as the index reference period. The CPI is arbitrarily set to equal 100 in the index base period. Therefore, all index values express price change in percentage terms in comparison to the index base period.
For example, if the index is 123.4, that means prices have increased 23.4% since the base period.
The rising inflation rates across states as per the CPI index are here.

Manipur, Tripura, Telangana, Lakshadweep, Jammu & Kashmir Sikkim, Tamil Nadu and Karnataka are the states witnessing the highest amount of inflation rate which is around and more than 90%.
Himachal Pradesh, Chandigarh, Punjab, Delhi, Meghalaya and Goa compared to other states are having inflation rates in the range of 70% but less than 80%.
Rest of the states fall in the range in between.
Macroeconomic indicators like inflation are focused upon India-level however, the ground-level situation and disparities are largely present amongst States of India. Therefore, state-wise analysis, that is, a bottom to top approach would provide better insights to all.
Way Forward
For the months of March, April and May 2023, the Government of India along with India level detailed CPI inflation index values of 6 categories, also provided State-wise Group and All Groups Consumer Price Indices. These were provisional estimates yet were helpful in understanding the level of price rise and accordingly adjust the household expenditure from the budget.
This type of fast frequency data on macroeconomic indicators such as Inflation should be continued to be provided for state-levels. It will help the individuals, investors, bankers and policymakers to make informed decisions based on relevant duration’s data based on their geographical location (as in the State).

Vaibhavi Pingale
Ms. Vaibhavi Pingale is a Visiting Faculty of Economics at Gokhale Institute of Politics and Economics, Pune & at Savitribai Phule Pune University. She is pursuing her PhD. She has been actively writing media articles other than academic research.

Nice insights. Thank you very much. Best wishes.