
Export Preparedness Index 2021
Following an export-oriented growth model has led India to become one of the fastest growing economies in the world. This has been possible due to the collective efforts taken by the Central and State Governments. More often than not, when one talks about exports, they usually pay heed to the country as a whole, and the contribution of the states is overlooked. States’ contribution to the growth of exports is just as important. Their contribution determines the total exports. And therefore, to ensure continued export growth and promotion, it is important for the states to have the necessary environment to do the same. The question of how to measure this necessity arises. In 2020, the NITI Aayog, in collaboration with the Institute for Competitiveness, released the Export Preparedness Index. The Index is a data-driven effort to identify the core areas crucial for export promotion at the state level.
In this final article in the Exports Series, using the Export Preparedness Index 2021, we analyse certain states based on the scores they received on certain parameters.
Export Preparedness Index 2021
The Export Preparedness Index (EPI) is a comprehensive analysis of India’s export achievements. It evaluates the states’ preparedness to meet long-term demand for domestic exports. The EPI ranks states and union territories (UTs) on four main pillars, 11 sub-pillars and a total of 60 indicators. The four main pillars are as follows:
- Policy
- Business Ecosystem
- Export Ecosystem
- Export Performance
In the 2021 Index, Gujarat ranked first overall with a score of 78.86, followed by Maharashtra (77.14), Karnataka (61.72), Tamil Nadu (56.84), Haryana (53.20), Uttar Pradesh (51.09), Madhya Pradesh (51.03), Punjab (50.99), Andhra Pradesh (50.39) and Telangana (47.92). The bottom ten ranking states/UTs are Puducherry (22.19), with a rank of 27, followed by Dadra Nagar and Haveli & Daman and Diu (17.8), Manipur (15.78), Andaman and Nicobar Islands (15.26), Nagaland (13.99), Ladakh (13.09), Mizoram (12.58), Arunachal Pradesh (11.18), and lastly, Lakshadweep, ranking 36th with a score of 2.12. The overall median score is 40.105.
In this analysis, we will be analysing the middle 16 states for each pillar. As the due attention is given to the top performing and bottom performing states, and the middle performers are kind of overlooked.
India is a diverse nation, with variations in the development of regions and states. Unless India brings all the states to a minimal level of development, inclusive growth would remain a dream.
For the same purpose, however, from an analytical perspective this article focuses on the middle performing 16 states on the basis of the Four pillars of the Export Preparedness Index.
Policy
The Policy Pillar covers the paramount trade policies such as export promotion policy and institutional framework vital for expansion of export business. It evaluates whether a particular policy has been implemented in the state or not.
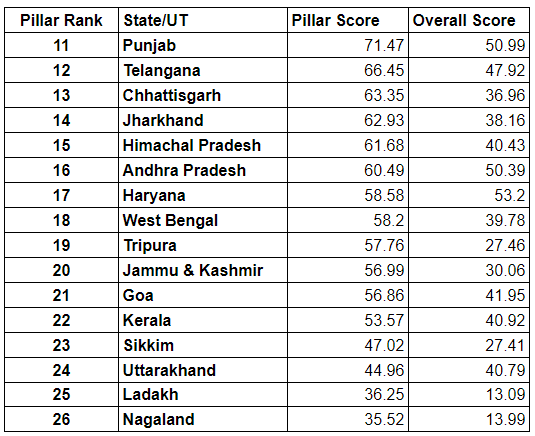
The median for the Policy pillar scores is 57.98.
There are certain lacuna from the states’ end leading to not upto mark performance. For example, it was found that Himalayan states & U.T. don’t have state-centre coordination cells and grievance redressal. This has reflected in their lower scores as an institutional framework helps the facilitation of businesses.
Business Ecosystem
The Business Ecosystem Pillar captures the performance of the states’ abilities to create a conducive ecosystem with regulatory ease and a facilitative environment that spurs business activity. It includes factors such as business environment, infrastructure, transport connectivity, and access to finance.
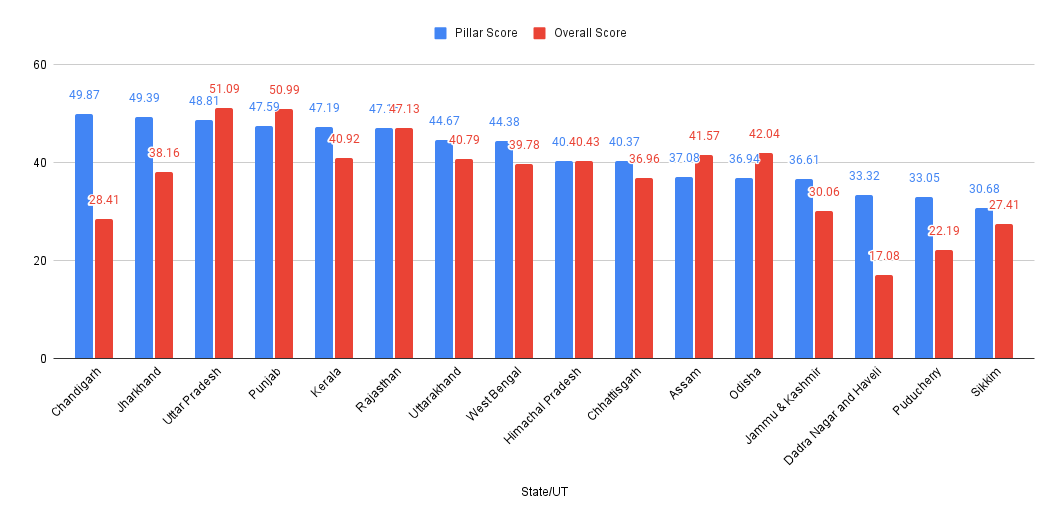
The median for the Business Ecosystem pillar scores is 42.39.
In this particular pillar, scores of states have a variety as they are good on certain parameters and then there is a room for the development.
Odisha’s coastal and landlocked counterparts have not attracted significant investments within the assigned period, but it has taken additional measures to create an enabling environment to attract businesses. The state has been rated as the most cost-competitive state judged by the cost of setting up and running a business. This initiative would pave a way further for export growth.
Loopholes in this pillar are found on multiple levels. For example, in terms of access to finance it has been observed that Himalayan states and U.T. scores relative to coastal and landlocked states accentuated. This is due to the higher percentage of banking facilities in the region, measured relative to its population, even though these regions have no loan schemes for exporters. Foreign Direct Investment (FDI) inflow as a percentage of state GDP is also less than 1 per cent, except for Delhi. Most of the Himalayan states do not even have the scheme provision to provide loans to their exporters.
Export Ecosystem
The Export Ecosystem Pillar covers indicators like Export Promotion Zones and Export Promotion Industrial Parks, which are essential to attract new investors and increase the productivity of the existing ones. The sub-pillars in this category involve export infrastructure, trade support, and Research & Development infrastructure.
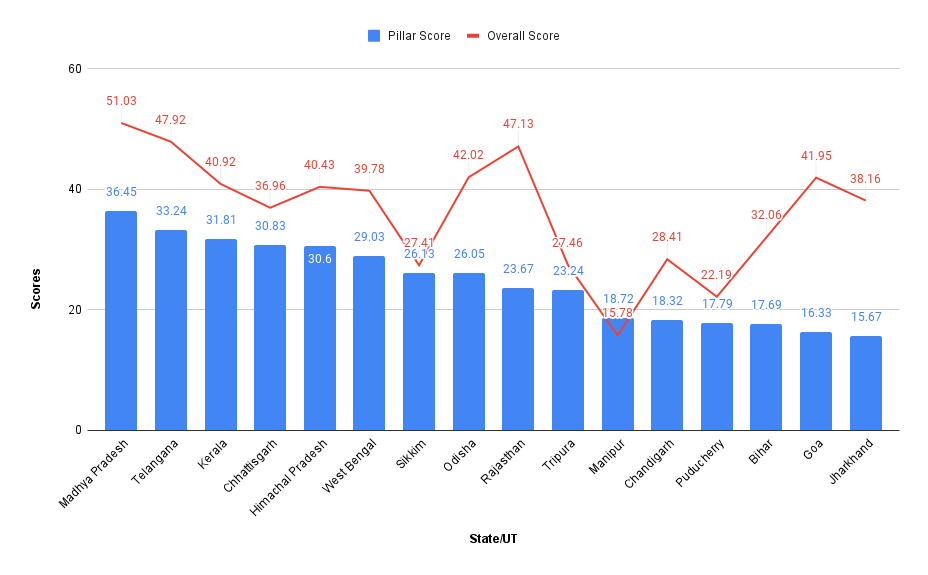
The median for the Export Ecosystem pillar scores is 26.86.
Overall, only 16 states provide a trade guide, and 19 states offer an online portal for exporters. This reflects that most states have a challenge in providing information related to existing infrastructure.
There are underlying aspects that need to be understood before coming to the conclusion. For example, indicators measured under this pillar are proportionate to either state population, Gross State Domestic Product (GSDP) or businesses. Therefore, their performance needs to be evaluated with caution. In the Himalayan category, states like Manipur (34.19), Uttarakhand (40.49) and Sikkim (50) have scored higher than the national average, i.e. 23.19. Similarly, scores of landlocked states, like Punjab (30.91), Madhya Pradesh (24.79) and Uttar Pradesh (24.52), are lower than states in the Himalayan category. Their scores were affected as they are measured relative to their large populations and businesses. It is not due to the bad performance of these states across R&D indicators.
Export Performance
The Export Performance Pillar, unlike others, is an output-based dimension such as growth and orientation and diversification of exports that examines the reach of export footprints of states and UTs.
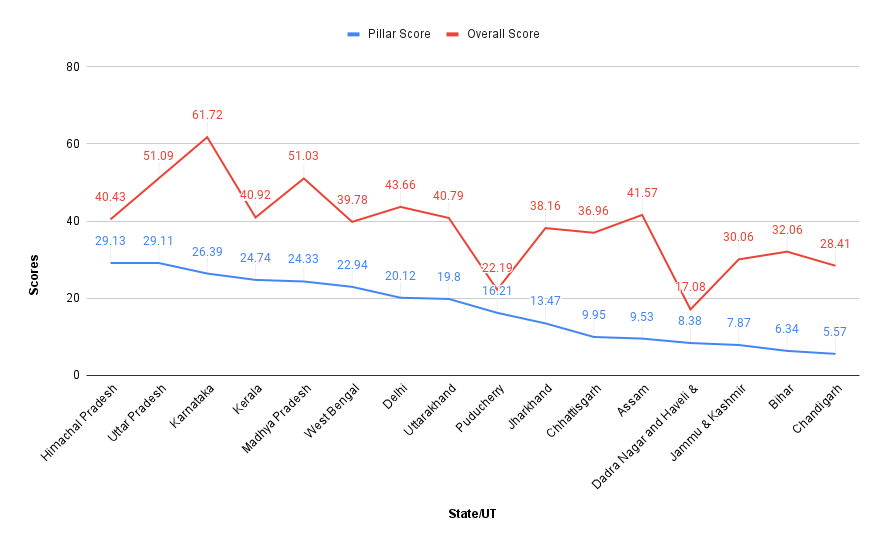
The median for the Export Performance pillar scores is 18.005.
Only 16 states out of 36 states/UTs have scored above the national average in the export performance pillar. Their performance has varied drastically for two reasons: Regional Export Disparity, as coastal states continue to dominate the export sector across states of India. Another reason is that indicators have been evaluated relative to their exports’ contribution to its GDP, which impacts scores of smaller regions.
States in the Himalayan category have untapped potential as they have borderland advantages in trade. Especially for states like Mizoram, Manipur, Sikkim, Tripura, which have the advantage of close trade borders with neighbouring countries. This has also been reflected in their average scores of 27.94 business ecosystems. It is low due to lack of infrastructure, volatile borders, weak business environment, weak transport connectivity to support exports. The potentiality is immense, but regions need to identify industries and products with comparative advantage.
To conclude, there is an increase in exporters in only 10 out of 36 regions reflecting the need to assess its existing initiatives to improve export growth and orientation.
Overall, from the list and graph it is evident that from these states onwards the fall in the performance begins. And, this downward slope stops at the low performing states. Precisely in the same context, a path to ensure that development is reaching till the last mile, over here, till the lowest performing states, goes through middle states. Economic backward and forward linkages, spillovers, and cooperation will help in developing middle and bottom ranging states of India.
India, to achieve a higher level of exports growth, should focus on the developmental needs of 16 middle performing states rather than only promoting top and bottom ones.

Vaibhavi Pingale
Ms. Vaibhavi Pingale is a Visiting Faculty of Economics at Gokhale Institute of Politics and Economics, Pune & at Savitribai Phule Pune University. She is pursuing her PhD. She has been actively writing media articles other than academic research.

Purvi Patil
Ms. Purvi Patil is a Research Assistant at Tatvita. She has pursued her graduation from the Liberal Arts Department of Savitribai Phule Pune University. Her areas of interest include International Relations, Data Protection and Privacy, and Sustainability.
