
Export Basket of India
An integral part of the economic growth and development story of an economy is the commodities and services it trades with other economies, because exports stimulate domestic economic activity by generating employment, production and revenues. After India’s 1991 Balance of Payments (BoP) crisis, as a part of its economic restructuring, it was mandated by the IMF that India open up its economy, otherwise known as “liberalisation, privatisation and globalisation” to participate in the global market. Since the BoP crisis, the Indian economy has grown nearly nine times.
In this article, we analyse Indian exports over a period of 27 years (1995-96 to 2021-22) to understand how the Indian scenario has changed over this period using Compound Annual Growth Rate (CAGR) and basic statistical analysis. We have predicted the export value for Financial Year (FY) 2022-23, FY 2023-24, FY 2024-25. For this analysis, we have used data from RBI’s Handbook of Statistics on Indian Economy and Ministry of Commerce’s Dashboard on trade.
Principal Commodities under Export Basket
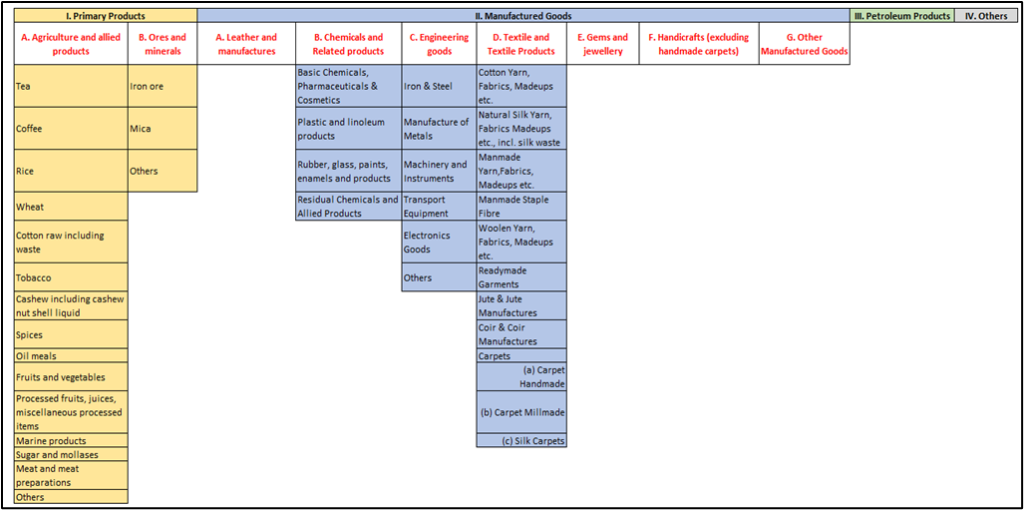
For the purpose of analysis, reference has been made to principal commodities in the export basket. These principal commodities, as shown in Figure 1. They are divided into four categories, namely primary products, manufactured goods, petroleum products and others.
Primary products have been further sub categorised into agricultural & allied Products and ores & minerals. The manufactured goods category has been further sub categorised into leather & manufactures, chemical & related products, engineering goods, textile & textile products, gems & jewellery, handicrafts (excluding handmade carpets) and other manufactured goods. Primary products include commodities like tea, coffee, rice, wheat, raw cotton, tobacco, cashew, spices, oil meals, fruits & vegetables, processed items, marine products, sugar and molasses, meat products, iron ore and mica, among others.
Manufactured goods include commodities like basic chemicals, pharmaceuticals & cosmetics, plastic & linoleum products, rubber, glass, paints, enamels, and products residual chemicals & allied products, iron & steel, manufacture of metals, machinery & equipments, transport equipment, electronic goods, cotton yarn, natural silk yarn, man-made yarn, woollen yarn, fabrics, madeups, man-made staple fibre, ready-made garments, jute & jute manufactures, coir & coir manufactures and carpets.
Growth of Exports
In FY 1995-96, the value of total exports was Rs. 1,06,353 crores. This figure grew to Rs. 31,47,021 crores by the end of FY 2021-22, garnering a CAGR of 13.92%.

The above figure graphically represents the change in the total value of exports over a period of 27 years. It can be observed that up until 2010-11, total exports have grown quite steadily. However, in 2011-12, we see a sharp fall in the total value of exports. The value of total exports fell sharply from Rs. 11,42,922 crores in 2010-11 to Rs. 1,46,596 crores in 2011-12, a whopping 87.17% decline.
This decline can be attributed to deteriorated trading conditions. These have reflected weakening of world demand, among other things, caused by the Eurozone crisis, a BoP Crisis in the European Union. Since then, it can be seen that the total exports have fluctuated, which were a result of fluctuating exchange rates.
It was reported that between 2011-12 and 2014-15, export values in USD increased marginally by 1.3 percent, while over the same period of time, the Indian Rupee depreciated by 9.5 percent. It was also reported that, over the five-year period, over 60 per cent of decline was accounted for by three industries, namely gems & jewellery (-15.1%), petroleum products (-46.6%) and agricultural products (-3.7%). Another important data point is in 2007-08, i.e., during the global financial crisis. During this period, exports have actually increased. Between 2019-20 and 2020-21, the total export value has declined quite steadily, as opposed to an abrupt decline.
Moving on, let us now look at the changes in the composition of the export basket. The following figures show how the proportion of the principal commodities has changed between 1995-96 to 2021-22.
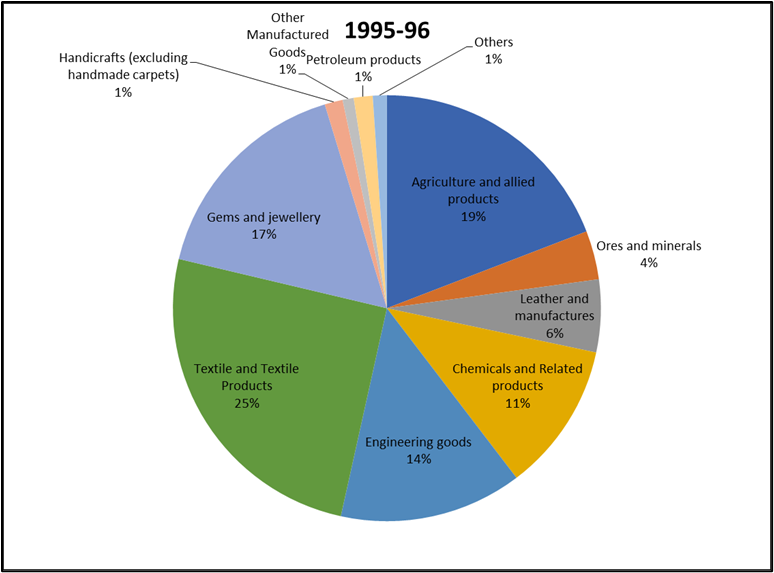

In 1995-96, textile & textile products accounted for a quarter of the exports basket, followed by agriculture & allied products (19%), gems & jewellery (17%), engineering goods (14%), chemicals & related products (11%), leather & manufactures (6%), ores & minerals (4%), while handicrafts, petroleum products, other manufactured goods and others accounted for 1% each.
In 2021-22, engineering goods contributed the most to the exports basket (28%), followed by petroleum products (18%), chemicals & related products (17%), agriculture & allied products (13%), textile & textile products (12%), gems & jewellery (10%), leather & manufactures (1%) and handicrafts (1%). The data for other manufactured goods and other categories was not available.
Figures 3 and 4 show the changes in each principal export commodities. Textile & textile products registered a decline of 17%, while agriculture & allied products declined by 6%. Gems & jewellery too declined by 7%. However, engineering goods and chemicals & related products registered an increase by 14% and 6% respectively. Leather & manufactures declined by 5%, while petroleum products increased tremendously by 17%. Handicrafts remained the same at 1%, while the data for ores & minerals, other manufactured goods and others were not available.
Predicting Future Exports Value
Firstly, the Cumulative Average Growth Rate (CAGR) for each principal commodity for the years 1995-96 to 2021-22 has been calculated. The CAGR of total exports is 14%. Each of the principal commodities, such as agriculture, ores and minerals, leathers and manufacturers, chemicals and related products, engineering goods, textile and textile products, gems and jewellery, handicrafts, other manufactured goods, petroleum products, and others have witnessed the CAGR of 12%, 8%, 7%, 15%, 17%, 10%, 11%, 10%, 18%, 25%, and 22% respectively.
To understand the future trend of exports of India, the exports have been predicted in absolute values for the years 2022-23, 2023-24 and 2024-25.
Based on these values, we predicted the export value for each Principal Export Commodity as shown below.
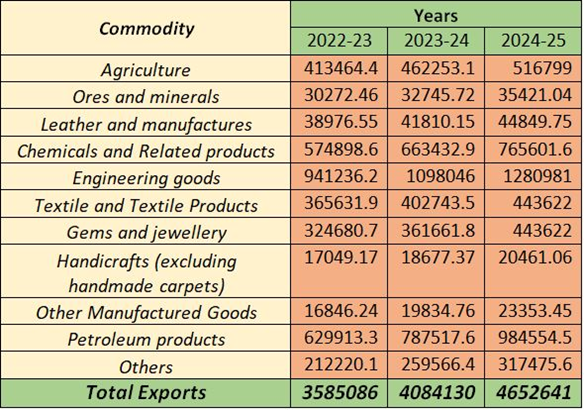
For FY 2022-23, 2023-24, 2024-25 the total exports would increase to Rs. 35 crores, Rs. 40 crores, and Rs. 46 crores respectively.
From the data analysis, it can be understood that the export basket of India has expanded and has a scope to widen further with the inclusion of several commodities. Once the export basket is expanded, the absolute values would also increase. More exports and foreign exchange reserves can help in developing the Indian economy further in detail.

Vaibhavi Pingale
Ms. Vaibhavi Pingale is a Visiting Faculty of Economics at Gokhale Institute of Politics and Economics, Pune & at Savitribai Phule Pune University. She is pursuing her PhD. She has been actively writing media articles other than academic research.

Purvi Patil
Ms. Purvi Patil is a Research Assistant at Tatvita. She has pursued her graduation from the Liberal Arts Department of Savitribai Phule Pune University. Her areas of interest include International Relations, Data Protection and Privacy, and Sustainability.
