
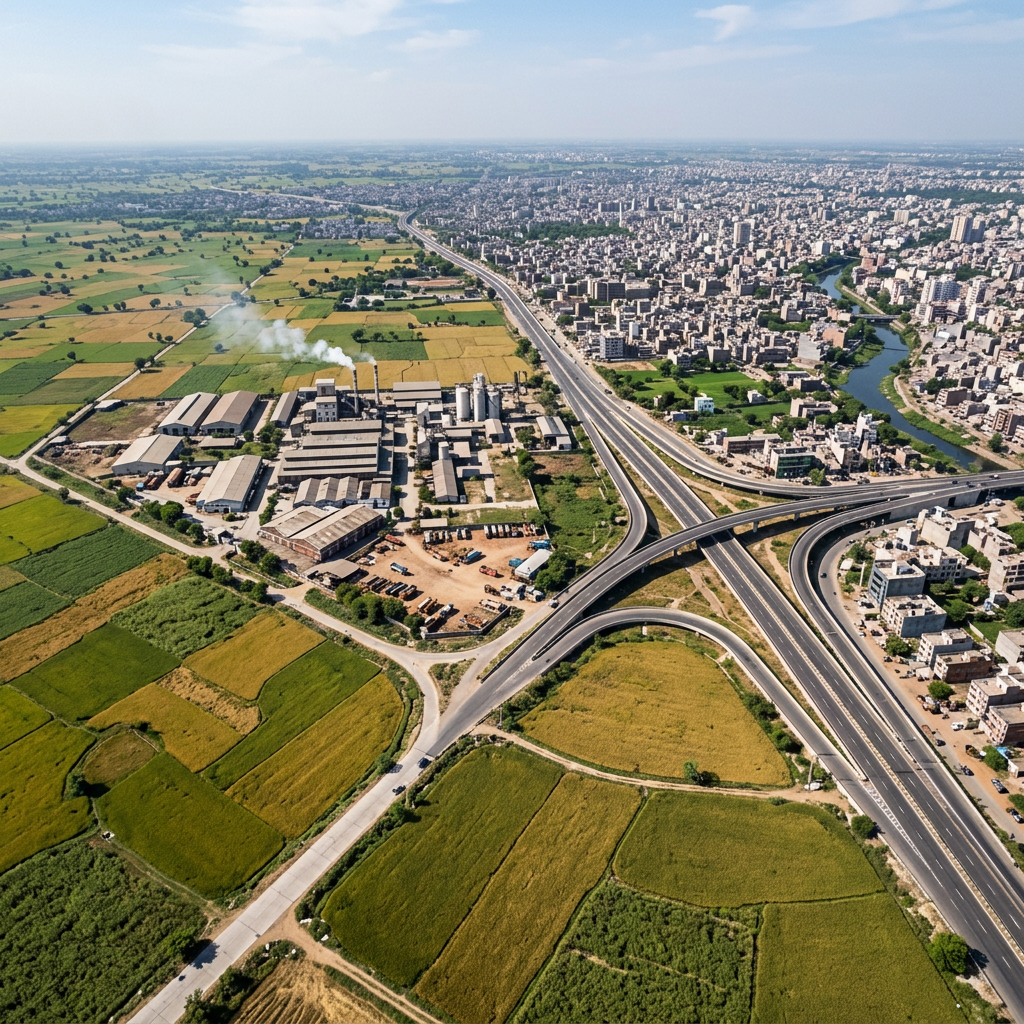
Most economies that grow richer follow a fairly well-worn script. Workers leave low-paying farms, move into factories that make the country’s exports, and only once wages and skills have risen far enough does the workforce shift again, this time into offices, shops and hospitals. Britain took this route over a century. Japan did it faster. South Korea and Taiwan did it in barely a generation. China is still doing it, at a scale the world has not seen before.
India’s story does not read the same way. Seventy-five years after Independence, the country looks as though it travelled almost directly from the farm towards the office, without spending very long inside the factory. Software exports, back-office services, finance and, more recently, global capability centres for multinational firms have carried a large share of India’s growth story, while the industrial base that historically absorbed millions of semi-skilled workers has grown only modestly.
Did India skip a step in its own development, and does that gap matter for the next seventy-five years?
The textbook version of structural transformation, associated with economists such as Arthur Lewis and Simon Kuznets, works roughly like this: a country begins with most of its people farming, at low productivity. As industry expands, workers move into manufacturing, where output per worker is far higher even for someone with modest schooling. This stage tends to matter enormously, because manufacturing has historically been able to absorb large numbers of people quickly, and because factories buy inputs from and sell outputs to many other parts of the economy, spreading the gains further than most other activities. Only later, once incomes and skills have risen, does a large services sector become the dominant employer.
Development economist Dani Rodrik has described a newer pattern among developing countries, where manufacturing’s share of output and jobs starts shrinking at a much lower level of national income than it did in today’s rich countries. He calls this premature deindustrialisation, and India is one of the economies most frequently cited in that discussion.
Seventy-five years, in three numbers
Look at how the three broad sectors have shared out India’s national income since 1950-51. The pattern is unusual less because agriculture shrank, which every developing economy expects, and more because of what filled the space it left behind.
Sectoral share of India’s gross value added, 1950–2025

The same numbers, stacked

Agriculture’s retreat from 55% to 18% of national income is not, on its own, unusual — nearly every economy that industrialises sees this. What is unusual is the destination of that lost share. Industry climbed steadily until the early 1990s reforms and has essentially gone sideways since, while services absorbed almost the entire decline in agriculture’s share on its own. By the time industry’s share peaked, in the early 2010s, it had barely touched 31%, a level several of India’s Asian neighbours crossed decades earlier and by a wider margin.
Where the people did not follow the output
Value added is only half the picture. Jobs are the other half, and here the mismatch is sharper still.
Share of GDP versus share of the workforce, by sector

GDP share versus workforce share, side by side

Agriculture employs close to half the country’s workers while producing less than a fifth of its income; services do roughly the opposite. This is not a new observation, but the direction of recent change is the striking part. According to the Economic Survey 2024-25, agriculture’s share of employment actually rose from 44.1% in 2017-18 to 46.1% in 2023-24, even as its share of output kept falling. In a normal structural transformation, workers should have been leaving farms for factories and formal services over this period. Instead, several of them appear to have gone back.
The manufacturing plateau
Manufacturing sits at the centre of this puzzle. Its share of GDP has hovered in a narrow 15-17% band for more than three decades, largely unmoved by the 1991 reforms, the 2003-08 boom, the Make in India push after 2014, or the production-linked incentive schemes introduced from 2020 onward.
India’s manufacturing share of GDP has barely moved since 1993–94

Economists do not fully agree on how to read this plateau. Most nominal, current-price estimates support the stagnation story above. A smaller body of research, using constant-price data adjusted through a technique called double deflation, argues that manufacturing’s real share of GDP has actually risen substantially since the early 2000s, and that the stagnation is partly a statistical artefact of how input and output prices have moved differently. It is worth holding both findings in mind. What is harder to dispute is the employment evidence: however manufacturing’s output share is measured, the sector’s ability to employ people at scale has not grown in line with the rest of the economy. Construction, not manufacturing, has been the bigger employment sponge within industry, now employing more workers than the factory floor does.
How India compares with its neighbours
Placing India alongside the economies most often cited as manufacturing success stories makes the gap easier to see.
Manufacturing share of GDP, India and selected Asian economies (latest available year)

Manufacturing share of GDP, by country

There is a detail here that is easy to miss. Between 2011 and 2023, India’s manufacturing share of GDP fell by about 3 percentage points — a smaller drop than China’s (around 6 points) or South Korea’s (around 4 points). On the surface, that makes India look like the more stable performer of the three. It is not. China’s share fell from a much higher peak of roughly 32% before 2012, and Korea’s from a similarly high base. India’s line looks flatter mainly because it never climbed very far to begin with. A plateau at 17% and a decline from 32% can produce a similar-looking recent trend while describing two very different industrial histories.
Why the middle rung went missing
No single explanation accounts for this pattern; several forces have worked together over different decades.
- A capital-intensive industrial legacy. Policy from the 1950s to the 1980s favoured heavy, capital-goods industries under licensing controls, rather than the labour-intensive, export-oriented light manufacturing that powered East Asia’s job-rich growth.
- A comparative advantage that arrived early, in services. English-language skills, a large pool of engineering graduates and falling telecom costs let Indian firms plug into global services trade particularly software and business process work — well before manufacturing had scaled up.
- Rigid labour regulation at scale. Firms crossing certain size thresholds face compliance costs that discourage them from growing, keeping much of manufacturing small, informal and less productive than it could be.
- Infrastructure and logistics costs that historically made India a more expensive place to manufacture and export from than comparable Asian economies, narrowing the space for large export-oriented factories.
- Construction as the default employment sponge. Workers leaving agriculture have more often ended up on construction sites — now employing more people than manufacturing does rather than in factories, a lower-productivity and less durable form of non-farm work.
What is lost when a rung is missing
Manufacturing’s historical importance was never only about its output. Its size lies in absorption the ability to take in large numbers of workers with modest formal education and gradually raise their productivity and in its linkages, since a factory buys steel, cloth, components and packaging from many other businesses, spreading demand well beyond its own four walls.
India’s growth has instead leaned on services that are high in value but narrow in reach. Information technology, financial services and professional services pay well and compete globally, but they employ a comparatively small, often highly educated, urban workforce. Some economists have described the result as a form of jobless or exclusionary growth, where national output rises briskly while the pace of formal job creation lags well behind. Over 90% of India’s workforce remains informal, without the job security, social protection or steady income growth that a formal factory job typically provides.
This is the practical cost of the missing rung. It is not that India has failed to grow — by most measures it has grown quickly and consistently. It is that a large part of the workforce has been left standing on one side of the ladder, in agriculture and informal work, while growth has occurred mostly on the other side, in urban services.
Conclusion
Closing the gap will need more than another manufacturing scheme announced in isolation. Production-linked incentives have helped in electronics and a handful of other segments, but incentives alone cannot substitute for the basics that make labour-intensive manufacturing viable at scale: predictable land acquisition, power and logistics costs that do not erode thin margins, and labour rules that let firms grow past a certain size without the compliance burden jumping sharply.
States that have quietly built functioning industrial clusters reliable power, single-window clearances, decent last-mile connectivity tend to attract this kind of manufacturing faster than those relying on subsidies alone; that pattern is worth studying and replicating rather than treating each state’s success as a one-off. Trade policy also needs to work in the same direction as industrial policy, since firms that are expected to compete globally need reasonably open access to the inputs and components they cannot yet make cheaply at home. None of this is a single fix, and none of it will show results within one budget cycle. But it is a more useful checklist than waiting for the next incentive scheme to do the work on its own.
The evidence assembled here does not point to a failed economy. India’s growth has been real, and its services sector has been genuinely competitive by global standards. What the data shows instead is an imbalance: national income has shifted toward a sector that employs a relatively narrow, urban, and educated segment of the workforce, while the majority of workers remain in agriculture or informal employment, sectors that have not kept pace in either productivity or income.
This is a structural gap, not a policy failure in any single year, and it will not close through one scheme or one budget cycle. It will require sustained attention to the conditions that make labour-intensive manufacturing viable at scale, reliable infrastructure, workable land and labour regulation, and trade policy aligned with industrial policy. Whether India’s next phase of growth looks different from the last three decades will depend on whether these fundamentals are addressed consistently over time, rather than treated as a one-time correction.
The underlying question is not whether India can sustain a strong services sector; it already has. It is whether the rest of the economy can be brought closer to it.
Author

Make Tatvita one of your preferred sources
See more insights from Tatvita Analysts in your Google Search results.


Leave a Reply