
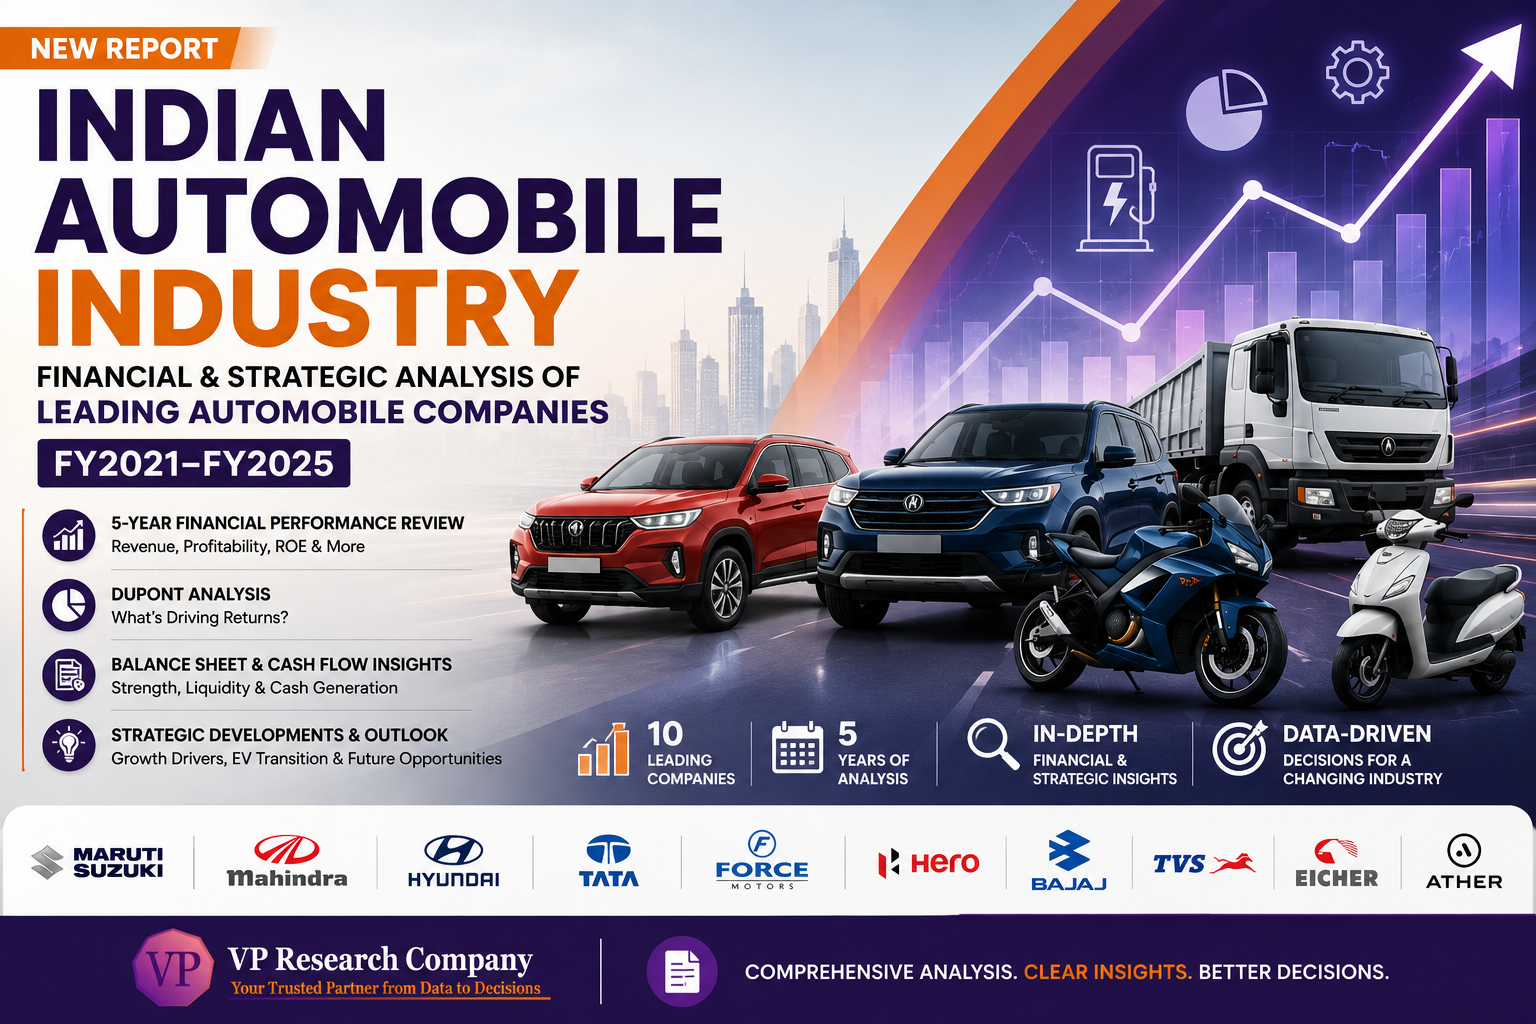
India’s automobile companies have grown strongly over the last five years. But are they becoming financially stronger or simply bigger?
Between FY2021 and FY2025, India’s automobile industry moved through pandemic disruption, supply-chain pressures, demand recovery, premiumisation and the accelerating transition towards electric mobility.
The results, however, have not been uniform.
Some companies converted growth into significantly stronger margins and shareholder returns. Others relied more heavily on asset utilisation or financial structure. Established manufacturers generated the cash needed to fund their next phase of transformation, while emerging EV businesses continued to face the challenge of achieving scale alongside profitability.
This report examines what the financial numbers reveal about ten leading automobile companies in India and what they may indicate about the industry’s next phase of competition.
10 Companies. 5 Years. Different Financial Stories.
The report studies:
Maruti Suzuki | Mahindra & Mahindra | Hyundai Motor India | Tata Motors Passenger Vehicles | Force Motors | Hero MotoCorp | Bajaj Auto | TVS Motor Company | Eicher Motors | Ather Energy
Rather than ranking these companies simply by sales or profits, the research asks:
What is actually driving their financial performance?
Profit Is Not the Same as Financial Strength
A company can report higher profits while:
- using its assets inefficiently,
- increasing financial leverage,
- consuming cash,
- undertaking heavy capital expenditure, or
- weakening its short-term financial position.
Conversely, a company can report significant investing cash outflows while actually building capacity for future growth.
The report therefore goes beyond revenue and PAT to examine:
Liquidity | Leverage | Profitability | Asset Efficiency | Cash Generation | Capital Investment | Shareholder Returns
What Is Really Driving ROE?
One of the report’s central analytical tools is DuPont decomposition.
Instead of stopping at:
Company X has an ROE of 30%.
the analysis asks:
Why?
Is it because the company:
earns more profit from every rupee of sales?
generates more revenue from its assets?
or
uses greater financial leverage?
The distinction matters because two companies with similar ROE can have very different financial quality and risk profiles.
The EV Question Makes the Comparison Even More Interesting
The report also includes Ather Energy, creating a useful contrast between established automobile manufacturers and a newer electric-mobility business.
This raises a fundamentally different analytical question:
Should an emerging EV company be judged by the same financial benchmarks as a mature automobile manufacturer?
For an established manufacturer, profitability, ROE and free cash generation may dominate the assessment.
For an emerging EV company, the more important questions may be:
How quickly is revenue scaling? Are losses narrowing? How much capital is required? And what does the pathway towards sustainable profitability look like?
Questions the Full Report Explores
- Which companies converted revenue growth most effectively into profitability?
- Which manufacturers strengthened their balance sheets while expanding?
- Where is high ROE being driven by operating performance—and where does leverage play a larger role?
- Which companies are generating strong operating cash flows?
- Where are large cash outflows signalling financial pressure, and where do they represent investment for future growth?
- How different are the financial structures of passenger-vehicle and two-wheeler manufacturers?
- How should investors interpret the financial position of emerging EV companies differently from established manufacturers?
- Which companies appear financially better equipped to fund the automobile industry’s next technological transition?
The answers require looking beyond any single financial ratio.
Inside the Report
The full research provides a structured five-year assessment of each company through:
- Financial Ratio Analysis
Liquidity, leverage, profitability, efficiency, cash flow and valuation indicators. - DuPont Analysis
Breaking ROE into profitability, asset efficiency and financial leverage. - Balance-Sheet Analysis
How assets, equity, liabilities, working capital and investment changed over five years. - Cash-Flow Analysis
Where companies generated cash, where they invested it and how they financed their growth. - Strategic Developments
How capacity expansion, new products, EV investments, premiumisation, exports and changing business strategies interact with financial performance.
Who Should Read This Report?
This research is particularly relevant for investors and financial analysts, automobile and auto-component companies, corporate strategy teams, consultants, banks and financial institutions, researchers, business schools, management professionals and students of finance and strategy.
It is also useful for anyone trying to understand the Indian automobile industry beyond monthly vehicle sales and market-share headlines.
Why Download the Report?
The biggest company is not necessarily the most profitable.
The company with the highest ROE is not necessarily the most operationally efficient.
And the company investing the most cash is not necessarily financially weaker.
Understanding India’s automobile industry therefore requires asking a better question than:
Who sold the most vehicles?
The report asks:
Which leading automobile companies are converting growth into sustainable financial strength—and what is actually driving their performance?
Download the full report to explore the five-year company analysis, financial ratios, DuPont decomposition, balance-sheet and cash-flow assessment, strategic developments and comparative insights across India’s leading automobile companies.
Author

Make Tatvita one of your preferred sources
See more insights from Tatvita Analysts in your Google Search results.



Leave a Reply